在牌组消失前保存
这些记忆卡还没保存——离开页面后会消失。创建一个免费账户来保留它们,并解锁下面的所有功能。
- Save this deck to your account
- Study with spaced repetition
- Export to Anki (.apkg) or PDF
- Process documents up to 100 pages
- Images extracted from your PDFs
- Sharper text extraction & a more advanced AI model
What will you learn in Chapter 14?
What does the IS-LM model help derive?
What period's causes will be discussed?
What does the IS curve represent?
What is the equation for the IS curve?
What does the LM curve represent?
What is the equation for the LM curve?
What determines the equilibrium in the IS-LM model?
What is represented by the interest rate in the IS-LM model?
Total demand
Market price
Supply chain
Equilibrium interest rate
What does the equilibrium level of income represent?
Profit margin
Fixed costs
Equilibrium output, Y
Consumer surplus
What is the IS-LM model used for?
What does the equation Y = C(Y − T) + I(r) + G represent?
What does M/P = L(r,Y) signify in the IS-LM model?
In the IS-LM model, fiscal policy affects _______ and/or _______.
The equilibrium interest rate is represented by the intersection of the _______ and _______ curves.
The IS-LM model shows the equilibrium level of income as a function of _______ and _______.
What happens to the IS curve when there is an increase in government purchases?
What is the effect on equilibrium when the IS curve shifts to the right?
How does income change with an increase in government purchases?
What happens to the interest rate when government purchases increase?
The IS curve shifts to the right by _______ when government purchases increase.
What is the relationship between the IS curve and output when the curve shifts right?
Income falls
Income rises
No change
Output decreases
What visual representation illustrates the shift in the IS curve?
What happens to the IS curve when government purchases increase?
What is the effect of increased government purchases on income?
What does the increase in government purchases cause?
A rightward shift of the IS curve
A rightward shift of the LM curve
A decrease in income
No effect on the IS curve
The initial equilibrium is at point A. An increase in government purchases causes the IS curve to shift out by _______.
The IS curve shifts to the right by _______.
The graph shows the shifts in equilibrium due to the IS curve shifting to the right. 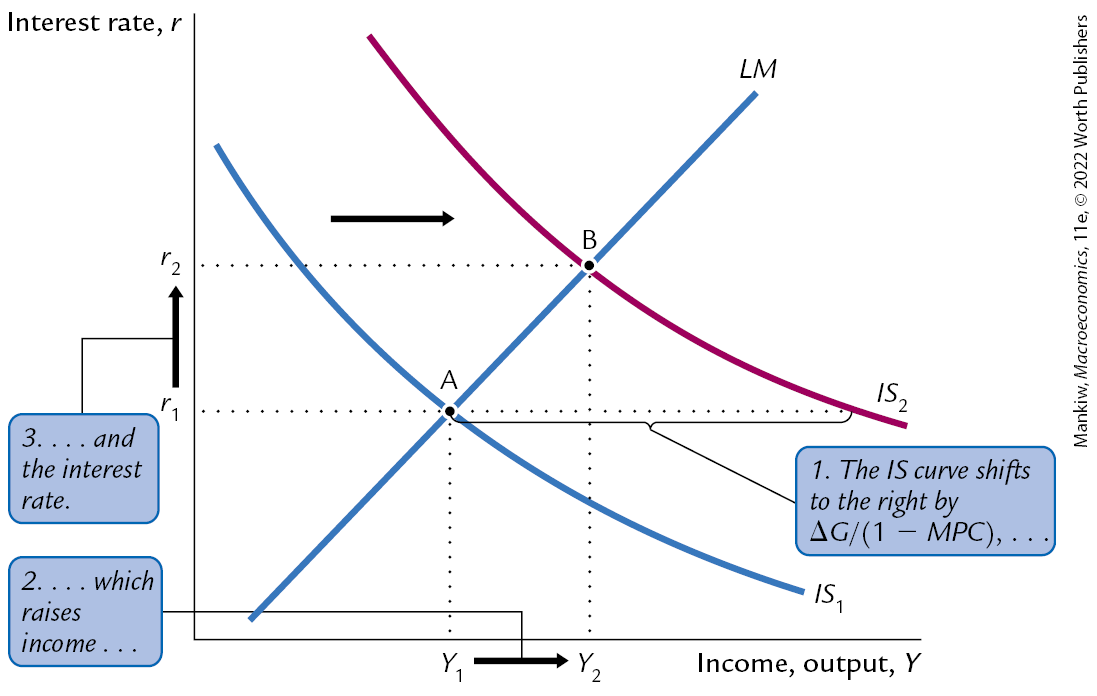
What is the result of an increase in government purchases on income?
What does the new equilibrium occur at after an increase in government purchases?
What happens to the interest rate as a result of higher income?
What happens to income when there is an increase in government purchases?
What shifts the IS curve in fiscal policy?
An increase in government purchases leads to a higher level of income: Y₁ increases to _______.
What happens when government purchases increase?
What effect does an increase in interest rates have on income?
What does the IS curve represent in fiscal policy?
The total government spending
The overall inflation rate
The level of imports and exports
The relationship between interest rates and income/output
What happens to the IS curve when there is a tax cut?
What is the effect of a tax cut on equilibrium income?
What is the change in the interest rate due to a tax cut?
How does a tax cut affect the IS curve?
Shifts to the right
Shifts to the left
Becomes vertical
No change
Following a tax cut, the equilibrium moves from point A to point B on the graph, indicating a shift in income from _______ to _______.
What is represented by the graph showing LM and IS curves after a tax cut?
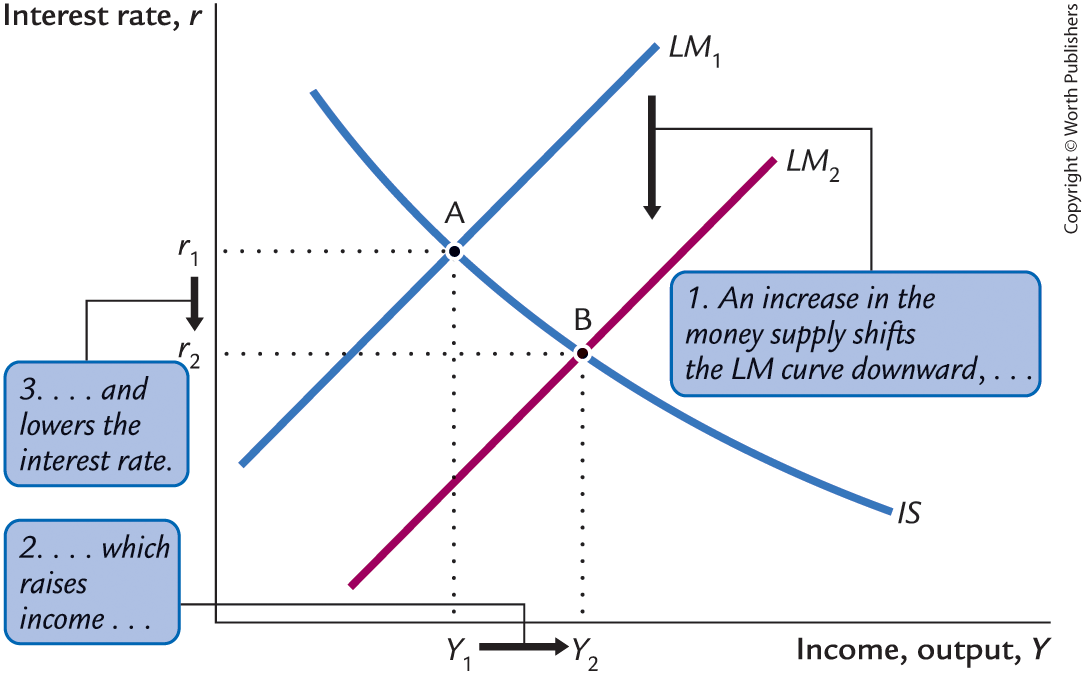
What happens to the LM curve when there is an increase in the money supply?
What is the result of the equilibrium moving from point A to point B?
What happens to the interest rate when the money supply increases?
It fluctuates.
It falls.
It stays the same.
It rises.
An increase in the money supply shifts the LM curve downward, resulting in income rising from _______ to _______.
The movement of the equilibrium from point A to point B indicates that the interest rate falls from _______ to _______.
What do the LM and IS curves represent?
Where can you find a graphical representation of the impacts on the economy through LM and IS curves?
What happens to the LM curve when there is an increase in the money supply?
How does an increase in the money supply affect the interest rate?
What is the effect on income/output (Y) due to an increase in the money supply?
What happens to the LM curve with an increase in the money supply?
What is the effect of an increase in the money supply on interest rates?
What effect does lowering the interest rate have on income?
What are the equilibrium points mentioned?
What moves in response to an increase in the money supply?
Interest rate increases
The equilibrium remains unchanged
The equilibrium moves from point A to point B
The LM curve shifts upward
What happens to the LM curve when the money supply increases?
What is the effect of increasing the money supply on interest rates?
What is the relationship between money supply increase and income levels?
What happens to the LM curve when there is an increase in money supply?
What is the effect of a downward shift in the LM curve on the interest rate?
How does an increase in money supply affect income?
What is the relationship shown in the graph regarding LM and IS curves?
Increase in tax rates
Shifts in equilibrium due to the LM curve shifting down
Decrease in interest rates only
Constant income level
An increase in the money supply causes the LM curve to shift _______ and leads to a decrease in the interest rate from _______ to _______.
What is the role of the LM curve in terms of interest rate and income?
What are the key exogenous variables in monetary and fiscal policy?
How might monetary policymakers respond to fiscal policy changes?
What is the effect of interactions between monetary and fiscal policy?
What is the Fed's response when Congress increases G?
How does holding M constant affect AG?
What happens when the Fed holds r constant in response to increased G?
What is the effect of holding Y constant when Congress increases G?
What happens to the IS curve when G is increased?
What is held constant by the Fed in this scenario?
What happens to the LM curve when the money supply is constant?
What effect does the increase in G have on income and interest rates?
What does the graph represent after the increase in G?
Decrease in income
A shift in the LM curve
A shift in the IS curve
No change in curves
An increase in G shifts the IS curve out while the Fed holds M constant, which means the LM curve stays the same. As a result, both income and the interest rate rise. The graph shows the relationship between income, output, and the curves: 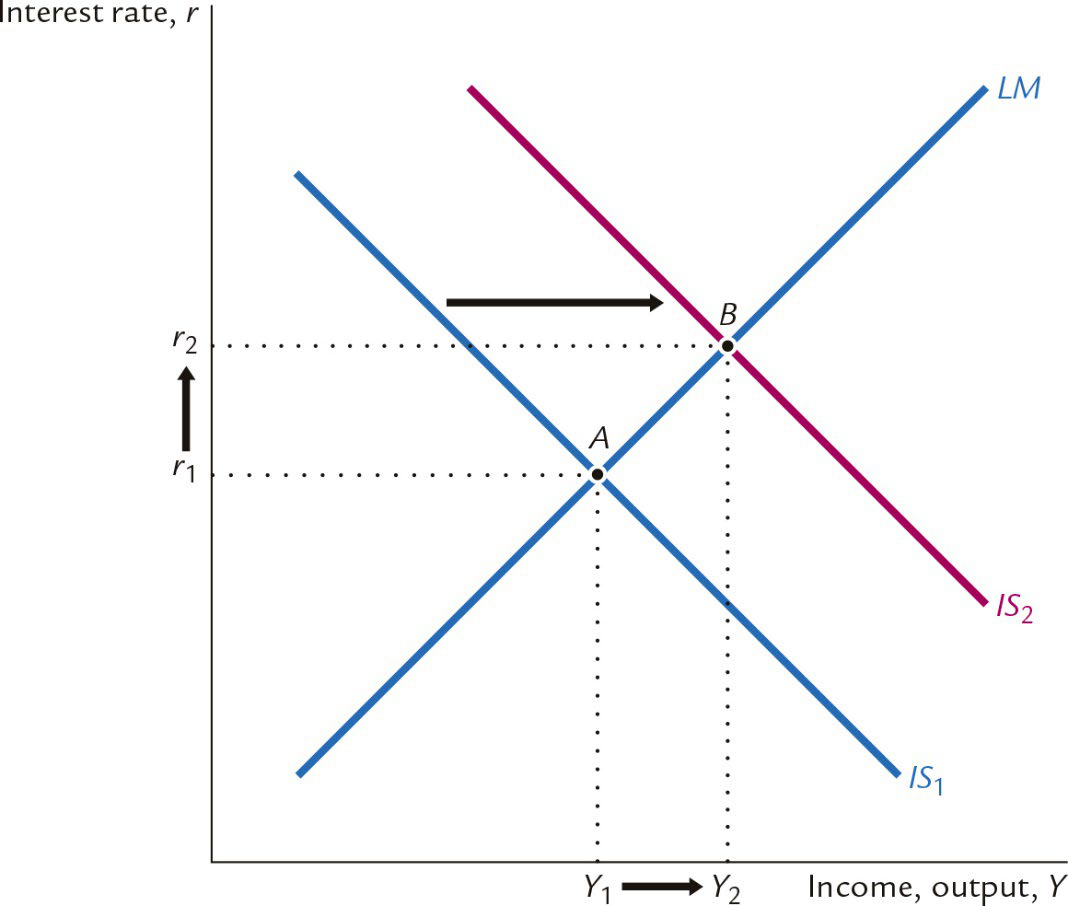
What happens when G increases while keeping r constant?
What does the Fed do to keep r constant when G increases?
How does income change if the Fed increases the money supply?
What does 'LM' represent in the context of this graph?
Local Market
Loan Market
Liquidity Preference-Money Supply
Long-run Model
In the graph, the interest rate is represented by _______ and the income is represented by _______.
The shift from _______ to _______ indicates the effect of increasing the money supply on the economy.
An increase in G shifts the IS curve out. To keep Y constant, the Fed then decreases the money supply, leading to interest rate movements represented as follows: 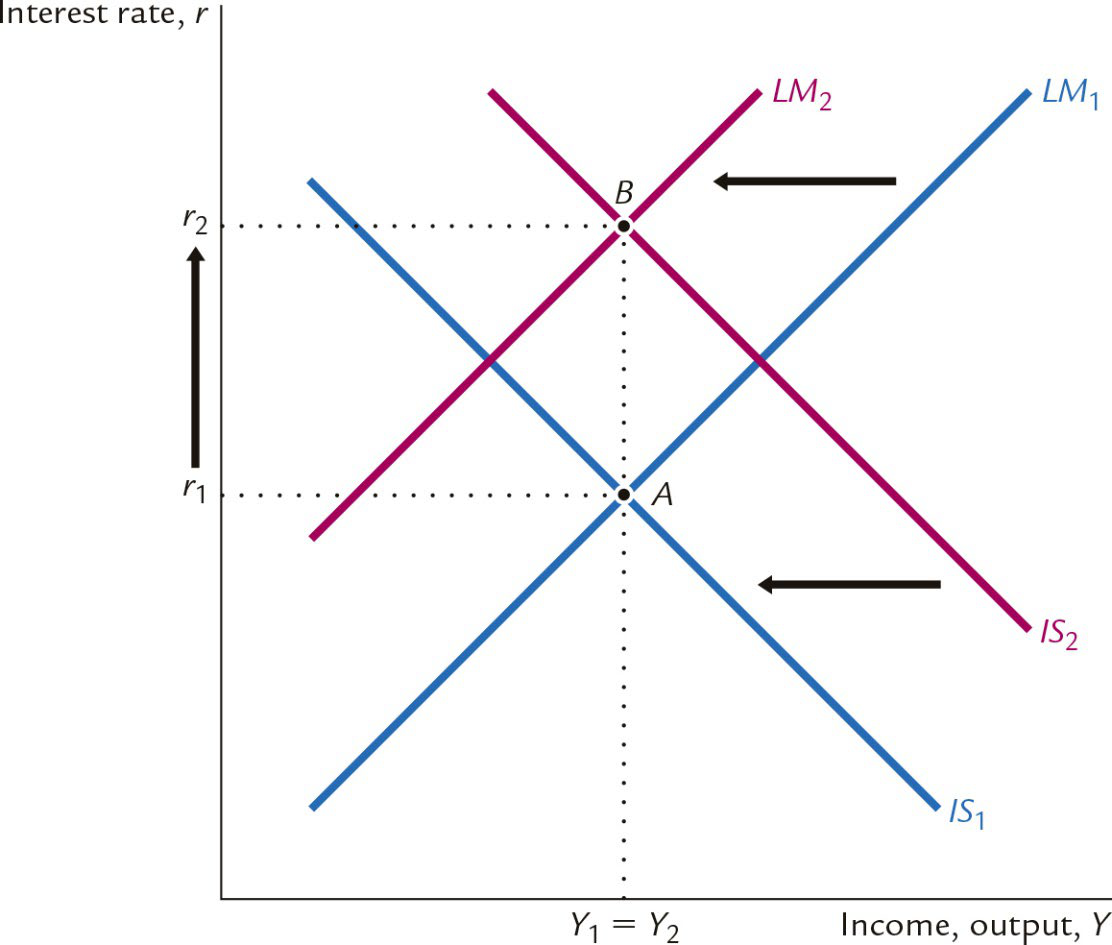 .
.
What does the Fed do to maintain constant Y after an increase in G?
What happens to the IS curve when G increases?
It shifts out.
It shifts in.
It becomes vertical.
It remains constant.
What are IS shocks in the IS-LM model?
What can cause a change in households' wealth in the IS model?
What factors can affect business or consumer confidence?
An example of an IS shock is a stock market boom or crash that leads to a change in households' wealth and affects ______.
A change in business or consumer confidence can lead to ΔI and/or AC in the IS-LM model.
What are LM shocks in the IS-LM model?
During Covid-19, what change occurred regarding cash usage?
What was the effect of more ATMs or the internet on money demand?
What happens to Y and r during a housing market crash that reduces consumers' wealth?
What are the effects on C, I, and the unemployment rate after a housing market crash?
What is the impact on Y and r when consumers use cash more due to identity theft?
What are the impacts on C, I, and the unemployment rate with increased cash usage due to identity theft?
What happens to the IS curve when shocks occur?
How does consumption (C) change due to shocks?
What is the effect on investment (I) when interest rates decrease?
According to Okun's law, what happens to unemployment (u) when income (Y) falls?
In the IS-LM model, when the IS curve shifts left, it results in a decrease in interest rate _______ and income _______.
What does a decrease in income (Y) lead to in the IS-LM model?
A decrease in interest rate (r)
An increase in unemployment (u)
An increase in consumption (C)
An increase in investment (I)
What does the LM and IS graph illustrate?
What happens to the LM curve when shocks are analyzed using the IS-LM model?
What is the effect on the interest rate (r) when the LM curve shifts left?
What is the effect on income (Y) when the LM curve shifts left?
What happens to consumption (C) due to lower income?
How does the rising interest rate (r) affect investment (I)?
What happens to unemployment (u) when income (Y) falls?
According to Okun's law, when income (Y) falls, _____ rises.
What is shown in the provided graph related to the LM and IS curves?
How many jobs were lost in the U.S. recession of 2001?
What was the unemployment rate increase during the 2001 recession?
What was the GDP growth rate in 2001?
What was the average annual GDP growth from 1994 to 2000?
What caused the decline of the S&P 500 from August 2000 to December 2001?
How did the 9/11 attacks affect economic confidence?
What was the effect of corporate accounting scandals like Enron and WorldCom?
What was the fiscal policy response during the U.S. recession of 2001?
What were some specific spending increases during the recession of 2001?
What was the impact of the monetary policy response during the U.S. recession of 2001?
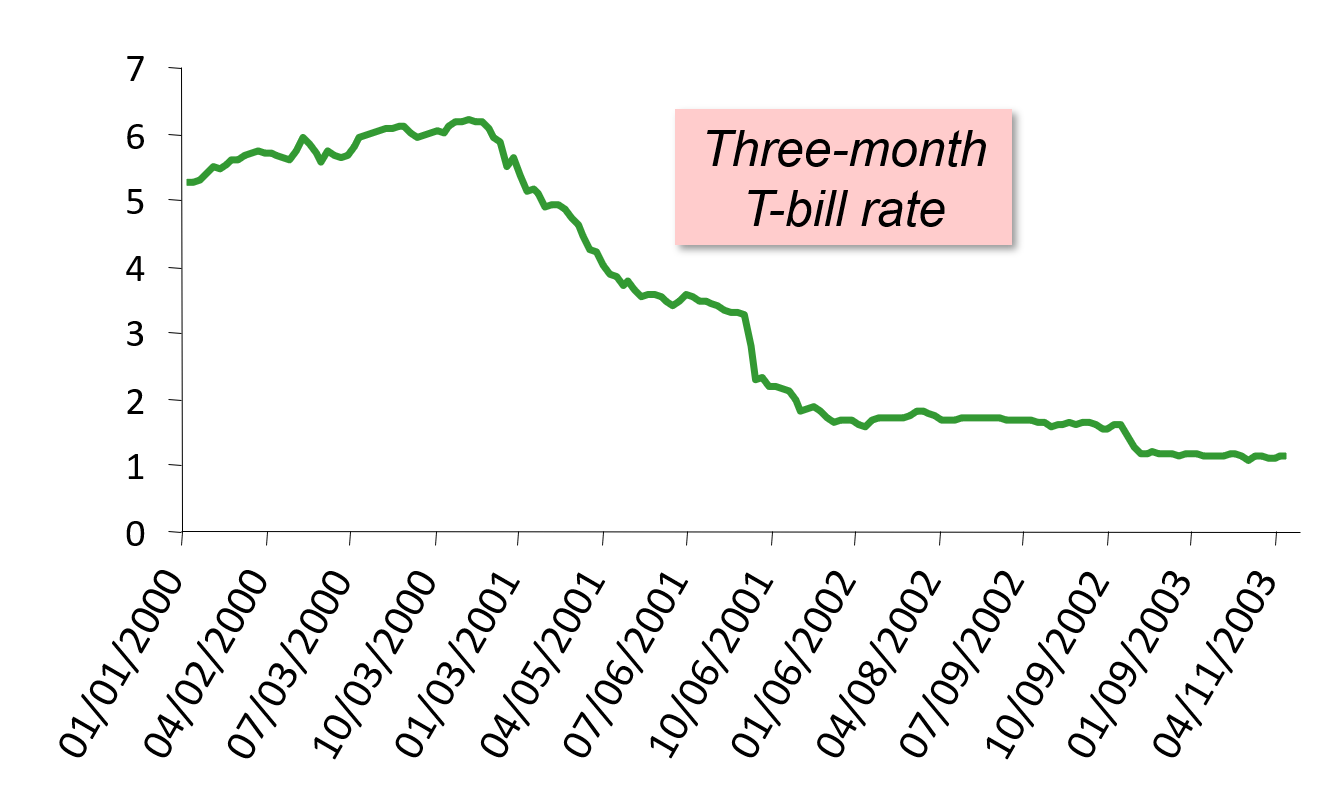
What trend did the Three-month T-bill rate exhibit from January 2000 to April 2003?
The monetary policy response during the U.S. recession of 2001 shifted the _______ to the _______.
What direction did the Three-month T-bill rate move from January 2000 to April 2003?
It remained constant.
It increased over time.
It declined over time.
It fluctuated widely.
What visual representation illustrates the decline of the Three-month T-bill rate?
What interest rate does the Fed primarily target?
What do media reports often equate with Fed policy changes?
How does the Fed influence the federal funds rate?
What happens to other short-term rates when the federal funds rate changes?
What is the Fed's primary policy instrument?
Why does the Fed target interest rates?
What does the IS-LM model analyze?
What happens when there is a change in P?
What captures the relationship between P and Y?
What does the IS-LM model illustrate?
How does an increase in price level (P) affect the LM curve?
What does the Aggregate Demand (AD) curve represent?
What happens to income (Y) when the LM curve shifts upward due to a higher price level (P)?
Fluctuates
Increases
Stays the same
Decreases
What happens to the LM curve during expansionary monetary policy?
What is the effect of expansionary monetary policy on income (Y)?
How does the AD curve react to expansionary monetary policy?
What is a primary goal of expansionary monetary policy?
Reduce inflation
Decrease income
Increase interest rates
Increase aggregate demand
In expansionary monetary policy, a decrease in the interest rate leads to an increase in investment (\(I\)) and subsequently income (\(Y\)): \(↑M → LM ext{ shifts right} → ↓r → ↑I → ↑Y\).
What does ↑M represent in monetary policy?
What is depicted in the IS-LM model related to expansionary monetary policy?
What does the rightward shift of the AD curve indicate?
What happens to aggregate demand during an expansionary fiscal policy?
In expansionary fiscal policy, increasing government spending (↑G) leads to a shift in the IS curve to the right, which results in an increase in Y at each value of P.
What is the graphical representation of expansionary fiscal policy?
What is the primary outcome of shifting the IS curve in an expansionary fiscal policy?
What do the two graphs of the IS-LM model illustrate during an expansionary policy?
What drives the economy from the short run to the long run?
In short-run equilibrium, what happens if Y > Ȳ?
Price level will remain constant.
Price level is unchanged.
Price level will fall.
Price level will rise.
In short-run equilibrium, what happens if Y < Ȳ?
Price level will remain constant.
Price level is unchanged.
Price level will fall.
Price level will rise.
In short-run equilibrium, what happens if Y = Ȳ?
Price level will rise.
Price level will fall.
Price level is unchanged.
Price level will remain constant.
What happens to the price level when Y < Y?
What equilibrium does the economy move from in the IS-LM model?
In the Aggregate Supply and Demand model, what causes the shift in curves?
What curve shifts when the price level falls?
LM curve
AD curve
SRAS curve
P curve
IS curve
In the IS-LM model, as Y moves from K to C, the LM and SRAS curves shift due to a fall in price levels. The short-run equilibrium is at K and the long-run equilibrium is at _______.
What do the IS-LM and AD-AS models illustrate?
What significant economic event began in the 1930s?
The Great Depression of the 1930s is often compared to the Great Recession of _______.
Which period is considered one of the worst economic downturns in US history?
Dot-com bubble
Great Recession
Great Depression
Financial Crisis of 2008
How was industrial production during the Great Depression affected compared to peak levels?
What does the graph provided illustrate?
What does the spending hypothesis assert about the Depression?
The spending hypothesis states that the Depression was due to an exogenous fall in the demand for goods and services, causing a _______ of the IS curve.
What evidence supports the spending hypothesis?
What event reduced consumption in 1929?
By how much did the S&P 500 fall from October 1929 to December 1929?
What was the percentage drop in the S&P 500 from October 1929 to December 1933?
What led to a drop in investment in the 1920s?
What made it harder to obtain financing for investment during the Great Depression?
What caused the Depression according to the Money Hypothesis?
By what percentage did M1 fall during 1929–1933?
What happened to P during 1929–1931?
What happened to nominal interest rates during the Depression?
What percentage did prices fall during the Great Depression (1929–1933)?
What was probably the cause of deflation during the Great Depression?
What role did money play during the Great Depression?
The severity of the Great Depression was due to a huge _______.
In what ways does a _______ affect the economy?
The stabilizing effects of deflation can be summarized as: ↓P → ↑(M/P) → LM shifts right → ↑Y.
The Pigou effect states that ↓P leads to ↑(M/P), which causes consumers' wealth to ↑, increasing C and shifting the IS curve right, leading to ↑Y.
What happens to expected deflation?
What is the effect of rising interest rates on investment?
What happens to planned expenditure in expected deflation?
What is the overall effect of expected deflation on income and output?
What is the theory that describes the destabilizing effects of unexpected deflation?
Unexpected deflation transfers purchasing power from _______ to _______.
What happens to borrowers' and lenders' spending when deflation occurs?
If borrowers' propensity to spend is larger than lenders', then aggregate spending falls, causing the IS curve to shift _______ and _______ to fall.
Why is another depression unlikely?
What role does federal deposit insurance play?
How do automatic stabilizers work during economic downturns?
What was the unemployment rate in 2009 during the financial crisis?
What was a major cause of the 2008-2009 financial crisis?
In 2009, real GDP fell, and the unemployment rate approached _______.
Key factors in the financial crisis included the _______ and the _______.
What was a consequence of the financial crisis?
Increasing consumer spending
Falling stock prices
Rising employment rates
Stable housing market
What was the amount of the American Recovery and Reinvestment Act (ARRA) passed in early 2009?
What happened to government spending between 2010-2014 after the ARRA?
What was the federal funds rate lowered to during the 2008-2009 crisis?
What nontraditional monetary policies were used during the crisis?
What is a liquidity trap?
What is another term for liquidity trap?
What does forward guidance in monetary policy entail?
What is quantitative easing (QE)?
What does the IS-LM model represent?
What are the exogenous factors in the IS-LM model?
What are the endogenous factors in the IS-LM model?
What does the IS curve represent?
What does the LM curve represent?
What does the AD curve show?
Why does the AD curve have a negative slope?
What effect does expansionary fiscal policy have on the AD curve?
What effect does expansionary monetary policy have on the AD curve?
What causes shifts in the AD curve?


Flashcards in this deck (245)
-
What will you learn in Chapter 14?
Analyzing the effects of shocks, fiscal policy, and monetary policy using the IS-LM model.
economics is-lm_model policies -
What does the IS-LM model help derive?
The aggregate demand curve.
economics is-lm_model aggregate_demand -
What period's causes will be discussed?
Several theories about what caused the Great Depression.
history great_depression -
What does the IS curve represent?
Equilibrium in the goods market.
economics is-lm -
What is the equation for the IS curve?
Y = C(Y – T) + I(r) + G
economics is-lm -
What does the LM curve represent?
Money market equilibrium.
economics is-lm -
What is the equation for the LM curve?
M/P = L(r,Y)
economics is-lm -
What determines the equilibrium in the IS-LM model?
The intersection of the IS and LM curves.
economics is-lm -
What is represented by the interest rate in the IS-LM model?
Total demand
Market price
Supply chain
Equilibrium interest rate
economics is-lm -
What does the equilibrium level of income represent?
Profit margin
Fixed costs
Equilibrium output, Y
Consumer surplus
economics is-lm -
What is the IS-LM model used for?
To analyze the effects of fiscal policy (G and/or T) and monetary policy (M).
economics is-lm policy -
What does the equation Y = C(Y − T) + I(r) + G represent?
The relationship between income (Y), consumption (C), investment (I), and government spending (G).
economics is-lm equations -
What does M/P = L(r,Y) signify in the IS-LM model?
The relationship between the real money supply (M/P) and the demand for money (L) as a function of interest rate (r) and income (Y).
economics is-lm equations -
In the IS-LM model, fiscal policy affects G and/or T.
economics policy is-lm -
The equilibrium interest rate is represented by the intersection of the LM and IS curves.
economics equilibrium is-lm -
The IS-LM model shows the equilibrium level of income as a function of income and output.
economics output is-lm -
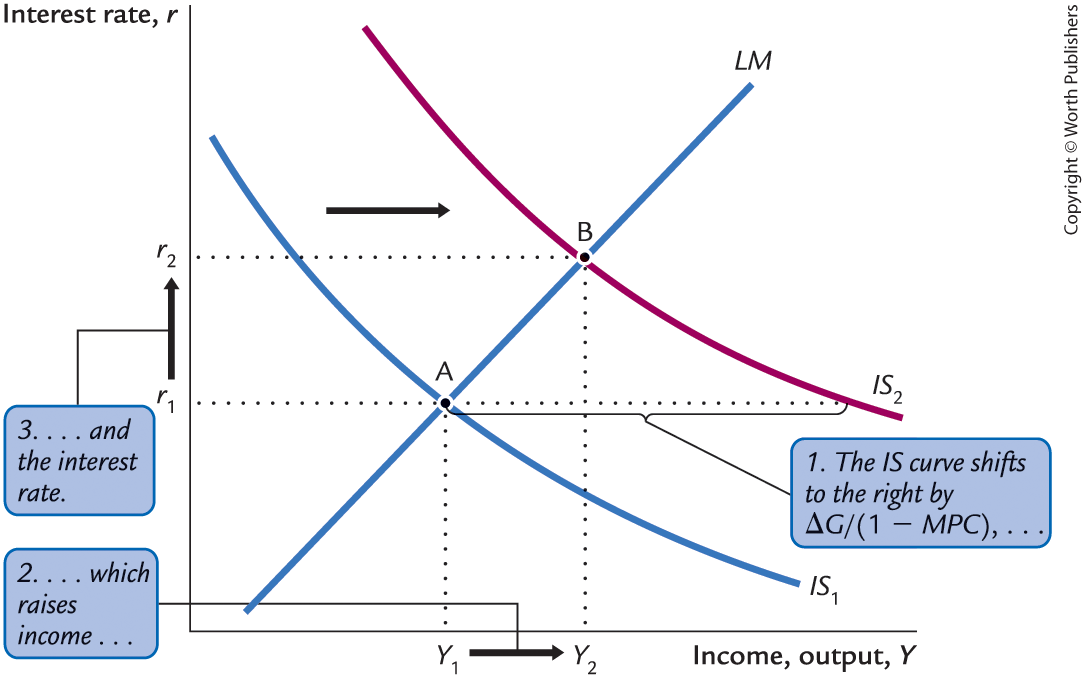
What happens to the IS curve when there is an increase in government purchases?
The IS curve shifts to the right.
economics fiscal_policy -
What is the effect on equilibrium when the IS curve shifts to the right?
Equilibrium moves from point A to point B.
economics equilibrium -
How does income change with an increase in government purchases?
Income rises from Y₁ to Y₂.
economics income -
What happens to the interest rate when government purchases increase?
Interest rate rises from r₁ to r₂.
economics interest_rate -
The IS curve shifts to the right by ∆G/(1 - MPC) when government purchases increase.
economics fiscal_policy -
What is the relationship between the IS curve and output when the curve shifts right?
Income falls
Income rises
No change
Output decreases
economics output -
What visual representation illustrates the shift in the IS curve?
See the graph showing IS and LM curves below:
 economics graph
 -
What happens to the IS curve when government purchases increase?
The IS curve shifts to the right by \( \Delta G/(1 - MPC) \).
economics fiscal_policy -
What is the effect of increased government purchases on income?
It raises income.
economics fiscal_policy -
What does the increase in government purchases cause?
A rightward shift of the IS curve
A rightward shift of the LM curve
A decrease in income
No effect on the IS curve
economics fiscal_policy -
The initial equilibrium is at point A. An increase in government purchases causes the IS curve to shift out by AG.
economics fiscal_policy -
The IS curve shifts to the right by \Delta G/(1 - MPC).
economics fiscal_policy -
The graph shows the shifts in equilibrium due to the IS curve shifting to the right.
economics graphs -
What is the result of an increase in government purchases on income?
Income increases from {{c1::Y1}} to {{c2::Y2}}.
economics income -
What does the new equilibrium occur at after an increase in government purchases?
The new equilibrium occurs at point {{c1::B}}.
economics equilibrium -
What happens to the interest rate as a result of higher income?
The interest rate increases from {{c1::r1}} to {{c2::r2}}.
economics interest_rate -
What happens to income when there is an increase in government purchases?
Income increases from Y₁ to Y₂.
economics fiscal_policy -
What shifts the IS curve in fiscal policy?
The IS curve shifts to the right by ∆G/(1 - MPC).
economics is_curve -
An increase in government purchases leads to a higher level of income: Y₁ increases to Y₂.
economics fiscal_policy -
What happens when government purchases increase?
Government purchases increase leads to a rightward shift of the IS curve by ∆G/(1 - MPC).
economics fiscal_policy -
What effect does an increase in interest rates have on income?
An increase in interest rates raises income, shifting it from Y₁ to Y₂.
economics fiscal_policy -
What does the IS curve represent in fiscal policy?
The total government spending
The overall inflation rate
The level of imports and exports
The relationship between interest rates and income/output
economics fiscal_policy -
What happens to the IS curve when there is a tax cut?
The IS curve shifts to the right.
economics fiscal_policy -
What is the effect of a tax cut on equilibrium income?
Income rises from Y₁ to Y₂.
economics fiscal_policy -
What is the change in the interest rate due to a tax cut?
The interest rate rises from r₁ to r₂.
economics fiscal_policy -
How does a tax cut affect the IS curve?
Shifts to the right
Shifts to the left
Becomes vertical
No change
economics fiscal_policy -
Following a tax cut, the equilibrium moves from point A to point B on the graph, indicating a shift in income from Y₁ to Y₂.
economics fiscal_policy -
What is represented by the graph showing LM and IS curves after a tax cut?
The graph shows shifts in equilibrium due to the IS curve moving right.
economics graphs -
What happens to the LM curve when there is an increase in the money supply?
It shifts downward.
economics monetary_policy -
What is the result of the equilibrium moving from point A to point B?
Income rises from Y₁ to Y₂, and the interest rate falls from r₁ to r₂.
economics equilibrium -
What happens to the interest rate when the money supply increases?
It fluctuates.
It falls.
It stays the same.
It rises.
economics interest_rate -
An increase in the money supply shifts the LM curve downward, resulting in income rising from Y₁ to Y₂.
economics monetary_policy -
The movement of the equilibrium from point A to point B indicates that the interest rate falls from r₁ to r₂.
economics equilibrium -
What do the LM and IS curves represent?
The LM curve represents money supply and demand, while the IS curve represents goods market equilibrium.
economics curves -
Where can you find a graphical representation of the impacts on the economy through LM and IS curves?
 economics graphs
 -
What happens to the LM curve when there is an increase in the money supply?
The LM curve shifts downward.
economics monetary_policy -
How does an increase in the money supply affect the interest rate?
It lowers the interest rate.
economics monetary_policy -
What is the effect on income/output (Y) due to an increase in the money supply?
It raises income.
economics monetary_policy -
What happens to the LM curve with an increase in the money supply?
The LM curve shifts downward.
economics monetary_policy -
What is the effect of an increase in the money supply on interest rates?
It lowers the interest rate.
economics interest_rates -
What effect does lowering the interest rate have on income?
It raises income.
economics income -
What are the equilibrium points mentioned?
- Point A
- Point B
economics equilibrium -
What moves in response to an increase in the money supply?
Interest rate increases
The equilibrium remains unchanged
The equilibrium moves from point A to point B
The LM curve shifts upward
economics monetary_policy -
What happens to the LM curve when the money supply increases?
The LM curve shifts downward.
economics monetary_policy -
What is the effect of increasing the money supply on interest rates?
It lowers the interest rate.
economics monetary_policy -
What is the relationship between money supply increase and income levels?
Income rises from Y₁ to Y₂.
economics monetary_policy -
What happens to the LM curve when there is an increase in money supply?
The LM curve shifts downward.
economics monetary_policy -
What is the effect of a downward shift in the LM curve on the interest rate?
The interest rate falls from r₁ to r₂.
economics interest_rate -
How does an increase in money supply affect income?
It raises income.
economics income -
What is the relationship shown in the graph regarding LM and IS curves?
Increase in tax rates
Shifts in equilibrium due to the LM curve shifting down
Decrease in interest rates only
Constant income level
economics graphs -
An increase in the money supply causes the LM curve to shift downward and leads to a decrease in the interest rate from r₁ to r₂.
economics monetary_policy -
What is the role of the LM curve in terms of interest rate and income?
The LM curve illustrates the relationship between interest rate and income.
economics lm_curve -
What are the key exogenous variables in monetary and fiscal policy?
- M (Monetary policy)
- G (Government spending)
- T (Taxes)
economics policy -
How might monetary policymakers respond to fiscal policy changes?
By adjusting M (Monetary policy).
economics policy -
What is the effect of interactions between monetary and fiscal policy?
They may alter the impact of the original policy change.
economics policy -
What is the Fed's response when Congress increases G?
- Hold M constant
- Hold r constant
- Hold Y constant
economics fed -
How does holding M constant affect AG?
It maintains the money supply despite changes in government spending.
economics monetary_policy -
What happens when the Fed holds r constant in response to increased G?
Interest rates are kept stable regardless of increased government spending.
economics interest_rates -
What is the effect of holding Y constant when Congress increases G?
Output remains unchanged despite additional government spending.
economics output -
What happens to the IS curve when G is increased?
The IS curve shifts out.
economics is_lm -
What is held constant by the Fed in this scenario?
The money supply, M.
economics monetary_policy -
What happens to the LM curve when the money supply is constant?
The LM curve stays the same.
economics lm_curve -
What effect does the increase in G have on income and interest rates?
Both income and the interest rate rise.
economics income interest_rate -
What does the graph represent after the increase in G?
Decrease in income
A shift in the LM curve
A shift in the IS curve
No change in curves
economics graphs -
An increase in G shifts the IS curve out while the Fed holds M constant, which means the LM curve stays the same. As a result, both income and the interest rate rise. The graph shows the relationship between income, output, and the curves:
economics is_lm -
What happens when G increases while keeping r constant?
The IS curve shifts out, leading to an increase in the money supply.
economics monetary_policy -
What does the Fed do to keep r constant when G increases?
The Fed increases the money supply.
economics monetary_policy -
How does income change if the Fed increases the money supply?
Income increases by more than if the Fed held M constant.
economics income -
What does 'LM' represent in the context of this graph?
Local Market
Loan Market
Liquidity Preference-Money Supply
Long-run Model
economics graphs lm -
In the graph, the interest rate is represented by r and the income is represented by Y.
economics graphs -
The shift from LM1 to LM2 indicates the effect of increasing the money supply on the economy.
economics graphs -
An increase in G shifts the IS curve out. To keep Y constant, the Fed then decreases the money supply, leading to interest rate movements represented as follows:
.economics is_lm -
What does the Fed do to maintain constant Y after an increase in G?
The Fed decreases the money supply.
economics policy -
What happens to the IS curve when G increases?
It shifts out.
It shifts in.
It becomes vertical.
It remains constant.
economics is_lm -
What are IS shocks in the IS-LM model?
Exogenous changes in the demand for goods and services.
economics is-lm -
What can cause a change in households' wealth in the IS model?
A stock market boom or crash.
economics is-lm -
What factors can affect business or consumer confidence?
Changes in expectations.
economics confidence -
An example of an IS shock is a stock market boom or crash that leads to a change in households' wealth and affects ______.
economics is-lm -
A change in business or consumer confidence can lead to ΔI and/or AC in the IS-LM model.
economics is-lm -
What are LM shocks in the IS-LM model?
Exogenous changes in the demand for money.
economics is-lm money -
During Covid-19, what change occurred regarding cash usage?
Consumers and companies switched to more cashless methods of payments.
economics covid-19 money -
What was the effect of more ATMs or the internet on money demand?
It led to a reduction in money demand.
economics money atms -
What happens to Y and r during a housing market crash that reduces consumers' wealth?
Y decreases; r decreases.
economics is-lm housing -
What are the effects on C, I, and the unemployment rate after a housing market crash?
- C decreases
- I decreases
- Unemployment rate increases
economics is-lm housing -
What is the impact on Y and r when consumers use cash more due to identity theft?
Y decreases; r decreases.
economics is-lm identity_theft -
What are the impacts on C, I, and the unemployment rate with increased cash usage due to identity theft?
- C decreases
- I decreases
- Unemployment rate increases
economics is-lm identity_theft -
What happens to the IS curve when shocks occur?
The IS curve shifts left, causing a decrease in interest rate (r) and income/output (Y).
economics is-lm -
How does consumption (C) change due to shocks?
Consumption (C) falls due to lower wealth and income.
economics is-lm consumption -
What is the effect on investment (I) when interest rates decrease?
Investment (I) rises because interest rate (r) is lower.
economics is-lm investment -
According to Okun's law, what happens to unemployment (u) when income (Y) falls?
Unemployment (u) rises because income (Y) is lower.
economics labor okun's_law -
In the IS-LM model, when the IS curve shifts left, it results in a decrease in interest rate r and income Y.
economics is-lm -
What does a decrease in income (Y) lead to in the IS-LM model?
A decrease in interest rate (r)
An increase in unemployment (u)
An increase in consumption (C)
An increase in investment (I)
economics is-lm -
What does the LM and IS graph illustrate?
The graph shows the IS curve shifting left due to shocks in the economy.
 economics is-lm graphs
 -
What happens to the LM curve when shocks are analyzed using the IS-LM model?
The LM curve shifts left.
economics is-lm -
What is the effect on the interest rate (r) when the LM curve shifts left?
The interest rate (r) rises.
economics interest_rate -
What is the effect on income (Y) when the LM curve shifts left?
Income (Y) falls.
economics income -
What happens to consumption (C) due to lower income?
Consumption (C) falls.
economics consumption -
How does the rising interest rate (r) affect investment (I)?
Investment (I) falls.
economics investment -
What happens to unemployment (u) when income (Y) falls?
Unemployment (u) rises.
economics unemployment -
According to Okun's law, when income (Y) falls, _____ rises.
economics okun's_law -
What is shown in the provided graph related to the LM and IS curves?
The LM curve shifts left, increasing the interest rate and decreasing income.
economics graph -
How many jobs were lost in the U.S. recession of 2001?
2.1 million jobs
economy recession -
What was the unemployment rate increase during the 2001 recession?
From 3.9 percent to 5.8 percent
economy unemployment -
What was the GDP growth rate in 2001?
0.8 percent
economy gdp -
What was the average annual GDP growth from 1994 to 2000?
3.9 percent
economy gdp -
What caused the decline of the S&P 500 from August 2000 to December 2001?
The S&P 500 fell from 1,500 to 1,150 due to a stock market decline.
economics recession stock_market -
How did the 9/11 attacks affect economic confidence?
- Increased uncertainty
- Fall in consumer and business confidence
- Resulted in lower spending
economics recession 9/11 -
What was the effect of corporate accounting scandals like Enron and WorldCom?
These scandals reduced stock prices and discouraged investment.
economics recession corporate_scandals -
What was the fiscal policy response during the U.S. recession of 2001?
- Tax cuts in 2001 and 2003
- Spending increases
economics fiscal_policy -
What were some specific spending increases during the recession of 2001?
- Airline industry bailout
- NYC reconstruction
- Afghanistan war
economics spending -
What was the impact of the monetary policy response during the U.S. recession of 2001?
It shifted the LM curve to the right.
economics monetary_policy -
What trend did the Three-month T-bill rate exhibit from January 2000 to April 2003?
The rate generally declined over time.
economics interest_rates -
The monetary policy response during the U.S. recession of 2001 shifted the LM curve to the right.
economics monetary_policy -
What direction did the Three-month T-bill rate move from January 2000 to April 2003?
It remained constant.
It increased over time.
It declined over time.
It fluctuated widely.
economics interest_rates -
What visual representation illustrates the decline of the Three-month T-bill rate?
 economics graphs
 -
What interest rate does the Fed primarily target?
The federal funds rate.
economics fed interest_rates -
What do media reports often equate with Fed policy changes?
Changes in market interest rates.
economics media interest_rates -
How does the Fed influence the federal funds rate?
By changing the money supply.
economics fed monetary_policy -
What happens to other short-term rates when the federal funds rate changes?
They typically move with the federal funds rate.
economics interest_rates monetary_policy -
What is the Fed's primary policy instrument?
The Fed targets interest rates.
economics fed policy -
Why does the Fed target interest rates?
- They are easier to measure than the money supply.
- Targeting interest rates stabilizes income better than targeting the money supply due to more prevalent LM shocks.
economics fed interest_rates -
What does the IS-LM model analyze?
The short run when the price level is assumed to be fixed.
economics is-lm -
What happens when there is a change in P?
It shifts LM and affects Y.
economics demand -
What captures the relationship between P and Y?
The aggregate demand curve.
economics aggregate_demand -
What does the IS-LM model illustrate?
The IS-LM model illustrates the relationship between interest rates and income/output.
economics is-lm -
How does an increase in price level (P) affect the LM curve?
A higher price level (P) shifts the LM curve upward.
economics lm_curve -
What does the Aggregate Demand (AD) curve represent?
The Aggregate Demand curve summarizes the relationship between price level (P) and income (Y).
economics ad_curve -
What happens to income (Y) when the LM curve shifts upward due to a higher price level (P)?
Fluctuates
Increases
Stays the same
Decreases
economics ad_curve -
What happens to the LM curve during expansionary monetary policy?
The LM curve shifts to the right, lowering interest rates.
economics monetary_policy -
What is the effect of expansionary monetary policy on income (Y)?
Income (Y) increases at each value of price level (P).
economics income -
How does the AD curve react to expansionary monetary policy?
The AD curve shifts to the right, indicating increased aggregate demand.
economics aggregate_demand -
What is a primary goal of expansionary monetary policy?
Reduce inflation
Decrease income
Increase interest rates
Increase aggregate demand
economics monetary_policy -
In expansionary monetary policy, a decrease in the interest rate leads to an increase in investment (\(I\)) and subsequently income (\(Y\)): \(↑M → LM ext{ shifts right} → ↓r → ↑I → ↑Y\).
economics monetary_policy -
What does ↑M represent in monetary policy?
It represents an increase in the money supply.
economics money_supply -
What is depicted in the IS-LM model related to expansionary monetary policy?
A shift of the LM curve to the right lowers interest rates and increases income.
economics is-lm_model -
What does the rightward shift of the AD curve indicate?
It indicates an increase in aggregate demand at any given price level.
economics aggregate_demand -
What happens to aggregate demand during an expansionary fiscal policy?
Aggregate demand increases due to fiscal policy measures like increasing government spending (↑G) or decreasing taxes (↓T).
economics fiscal_policy -
In expansionary fiscal policy, increasing government spending (↑G) leads to a shift in the IS curve to the right, which results in an increase in Y at each value of P.
economics is_curve -
What is the graphical representation of expansionary fiscal policy?
It is illustrated by shifts in the IS curve and the AD curve to the right, increasing income.
economics graphs -
What is the primary outcome of shifting the IS curve in an expansionary fiscal policy?
The primary outcome is an increase in income (Y) at each price level (P).
economics income -
What do the two graphs of the IS-LM model illustrate during an expansionary policy?
They illustrate the IS curve shifting to the right, indicating increased income and aggregate demand.
economics is-lm_model -
What drives the economy from the short run to the long run?
The gradual adjustment of prices.
economics theory -
In short-run equilibrium, what happens if Y > Ȳ?
Price level will remain constant.
Price level is unchanged.
Price level will fall.
Price level will rise.
economics equilibrium -
In short-run equilibrium, what happens if Y < Ȳ?
Price level will remain constant.
Price level is unchanged.
Price level will fall.
Price level will rise.
economics equilibrium -
In short-run equilibrium, what happens if Y = Ȳ?
Price level will rise.
Price level will fall.
Price level is unchanged.
Price level will remain constant.
economics equilibrium -
What happens to the price level when Y < Y?
The price level falls from P₁ to P₂.
economics is-lm ad-as -
What equilibrium does the economy move from in the IS-LM model?
From a short-run (Keynesian) equilibrium at K to a long-run (Classical) equilibrium at C.
economics is-lm -
In the Aggregate Supply and Demand model, what causes the shift in curves?
Falling price levels lead to shifts in the SRAS and AD curves.
economics ad-as -
What curve shifts when the price level falls?
LM curve
AD curve
SRAS curve
P curve
IS curve
economics is-lm ad-as -
In the IS-LM model, as Y moves from K to C, the LM and SRAS curves shift due to a fall in price levels. The short-run equilibrium is at K and the long-run equilibrium is at C.
economics is-lm ad-as -
What do the IS-LM and AD-AS models illustrate?
They illustrate the interaction between interest rates, income, and price levels in an economy.
economics models -
What significant economic event began in the 1930s?
The Great Depression
history economics -
The Great Depression of the 1930s is often compared to the Great Recession of 2008-2009.
history economics -
Which period is considered one of the worst economic downturns in US history?
Dot-com bubble
Great Recession
Great Depression
Financial Crisis of 2008
history economics -
How was industrial production during the Great Depression affected compared to peak levels?
It significantly decreased, as shown in the graph.
economics data -
What does the graph provided illustrate?
A comparison of industrial production during the Great Depression and the Great Recession.
economics data -
What does the spending hypothesis assert about the Depression?
The Depression was largely due to an exogenous fall in the demand for goods and services—a leftward shift of the IS curve.
economics depression is_curve -
The spending hypothesis states that the Depression was due to an exogenous fall in the demand for goods and services, causing a leftward shift of the IS curve.
economics depression is_curve -
What evidence supports the spending hypothesis?
Output and interest rates both fell, consistent with a leftward shift of the IS curve.
economics evidence is_curve -
What event reduced consumption in 1929?
The stock market crash.
economics history -
By how much did the S&P 500 fall from October 1929 to December 1929?
17 percent.
economics stock_market -
What was the percentage drop in the S&P 500 from October 1929 to December 1933?
71 percent.
economics stock_market -
What led to a drop in investment in the 1920s?
Correction after overbuilding.
economics investment -
What made it harder to obtain financing for investment during the Great Depression?
Widespread bank failures.
economics finance -
What caused the Depression according to the Money Hypothesis?
A huge fall in the money supply.
economics history -
By what percentage did M1 fall during 1929–1933?
By 25 percent.
economics data -
What happened to P during 1929–1931?
It fell even more than M1, causing M/P to rise slightly.
economics inflation -
What happened to nominal interest rates during the Depression?
They fell, contrary to what a leftward LM shift would cause.
economics interest_rates -
What percentage did prices fall during the Great Depression (1929–1933)?
- 25 percent
economics history great_depression -
What was probably the cause of deflation during the Great Depression?
- A fall in M (money supply)
economics deflation -
What role did money play during the Great Depression?
- It played an important role in the deflationary effects.
economics history money -
The severity of the Great Depression was due to a huge deflation.
economics great_depression -
In what ways does a deflation affect the economy?
economics deflation -
The stabilizing effects of deflation can be summarized as: ↓P → ↑(M/P) → LM shifts right → ↑Y.
economics deflation -
The Pigou effect states that ↓P leads to ↑(M/P), which causes consumers' wealth to ↑, increasing C and shifting the IS curve right, leading to ↑Y.
economics pigou_effect -
What happens to expected deflation?
It causes sinking prices and rising interest rates.
economics deflation -
What is the effect of rising interest rates on investment?
Investment decreases because \(I = I(r)\).
economics investment -
What happens to planned expenditure in expected deflation?
Planned expenditure and aggregate demand decrease.
economics aggregate_demand -
What is the overall effect of expected deflation on income and output?
Income and output decrease.
economics income output -
What is the theory that describes the destabilizing effects of unexpected deflation?
Debt-deflation theory
economics deflation -
Unexpected deflation transfers purchasing power from borrowers to lenders.
economics deflation -
What happens to borrowers' and lenders' spending when deflation occurs?
- Borrowers spend less
- Lenders spend more
economics deflation -
If borrowers' propensity to spend is larger than lenders', then aggregate spending falls, causing the IS curve to shift left and Y to fall.
economics is_curve -
Why is another depression unlikely?
- Policymakers know more about macroeconomics.
- The Fed avoids M drops during contractions.
- Fiscal policy avoids tax hikes in downturns.
economics policy -
What role does federal deposit insurance play?
It makes widespread bank failures very unlikely.
finance banking -
How do automatic stabilizers work during economic downturns?
They make fiscal policy expansionary.
economics policy -
What was the unemployment rate in 2009 during the financial crisis?
Approximately 10 percent.
economics financial_crisis -
What was a major cause of the 2008-2009 financial crisis?
- Early 2000s Federal Reserve interest rate policy
- Subprime mortgage crisis
- Bursting of house price bubble
- Rising foreclosure rates
- Falling stock prices
- Failing financial institutions
- Declining consumer confidence
economics financial_crisis -
In 2009, real GDP fell, and the unemployment rate approached 10 percent.
economics gdp -
Key factors in the financial crisis included the subprime mortgage crisis and the bursting of the house price bubble.
economics financial_crisis -
What was a consequence of the financial crisis?
Increasing consumer spending
Falling stock prices
Rising employment rates
Stable housing market
economics financial_crisis -
What was the amount of the American Recovery and Reinvestment Act (ARRA) passed in early 2009?
$787 billion
economics policy recovery -
What happened to government spending between 2010-2014 after the ARRA?
Decreased due to austerity measures (over a $300 billion drop)
economics spending austerity -
What was the federal funds rate lowered to during the 2008-2009 crisis?
Zero
economics monetary_policy -
What nontraditional monetary policies were used during the crisis?
- Forward guidance
- Quantitative easing
economics monetary_policy -
What is a liquidity trap?
A situation where interest rates fall to zero, making conventional monetary policy ineffective.
economics monetary_policy -
What is another term for liquidity trap?
Zero lower bound.
economics monetary_policy -
What does forward guidance in monetary policy entail?
Announcing future monetary actions, such as maintaining low interest rates until labor market conditions improve.
economics monetary_policy -
What is quantitative easing (QE)?
Buying of long-term government debt, mortgage-backed securities, corporate debt, and local debt.
economics monetary_policy -
What does the IS-LM model represent?
A theory of aggregate demand.
economics model -
What are the exogenous factors in the IS-LM model?
- M
- G
- T
- P (in short run)
economics factors -
What are the endogenous factors in the IS-LM model?
- r
- Y (in short run)
- P (in long run)
economics factors -
What does the IS curve represent?
Goods market equilibrium.
economics is_curve -
What does the LM curve represent?
Money market equilibrium.
economics lm_curve -
What does the AD curve show?
The relationship between price (P) and the equilibrium income (Y) in the IS-LM model.
economics ad_curve is-lm -
Why does the AD curve have a negative slope?
Because an increase in P leads to a decrease in (M/P), which raises r, lowers I, and decreases Y.
economics ad_curve negative_slope -
What effect does expansionary fiscal policy have on the AD curve?
It shifts the IS curve right, raises income, and shifts the AD curve right.
economics fiscal_policy ad_curve -
What effect does expansionary monetary policy have on the AD curve?
It shifts the LM curve right, raises income, and shifts the AD curve right.
economics monetary_policy ad_curve -
What causes shifts in the AD curve?
Shocks in the IS or LM curves can shift the AD curve.
economics shocks ad_curve -
-
-
-
-
-
-
-
-
-
-
-
-
-
-
-
-
-
-
-