Sauvegarde ton deck avant qu'il ne disparaisse
Ces flashcards ne sont pas encore sauvegardées — elles seront perdues si tu quittes. Crée un compte gratuit pour les garder et débloquer tout ce qui suit.
- Save this deck to your account
- Study with spaced repetition
- Export to Anki (.apkg) or PDF
- Process documents up to 100 pages
- Images extracted from your PDFs
- Sharper text extraction & a more advanced AI model
What does Forex stand for?
What is the purpose of Forex trading?
What is the size of the Forex market?
When does the Forex market operate?
Who participates in Forex trading?
What influences exchange rates in Forex?
When did the modern Forex market begin to take shape?
What caused the shift to floating exchange rates?
What role does the Forex market play in the global economy?
How does Forex differ from stock markets?
What is one key feature of the Forex market?
What is a significant advantage of Forex trading?
What is a broker in the Forex market?
What is a trading platform?
What are the popular trading platforms in Forex?
What are currency pairs in Forex trading?
What is an example of a currency pair?
What determines the exchange rate of a currency pair?
What types of currency pairs exist in Forex?
What is the mindset of a successful trader?
Why is discipline important in trading?
What role does patience play in trading?
What should a trading plan define?
What are key traits of successful traders?
What is Day Trading?
What is Swing Trading?
What is Trend Trading?
What is Scalping Trading?
What is the goal of Scalping Trading?
What is Range Trading?
What is Breakout Trading?
What does VSA stand for in trading?
How does VSA differ from candlestick analysis?
What is essential for developing a successful trading mindset?
What indicates the entry of smart money into the market?
What is the volume confirmation method for trading?
What are two types of volume to consider for trading?
What are charting platforms used for?
What role does news and market analysis play in trading?
What is the purpose of trading platforms?
What are technical analysis indicators used for?
What do fundamental analysis tools analyze?
What are risk management tools in trading?
What are candlesticks used for in trading?
What does the body of a candlestick represent?
What color indicates a price increase in candlesticks?
What color indicates a price decrease in candlesticks?
What do the wicks of a candlestick represent?
What are the two types of indicators in trading?
What is the purpose of leading indicators?
What is a Moving Average?
What does the Relative Strength Index (RSI) measure?
What does the Stochastic Oscillator compare?
What does MACD stand for?
What can MACD help identify?
Why should leading indicators be combined with other techniques?
What are lagging indicators in trading?
What is the purpose of Moving Averages?
What do Bollinger Bands consist of?
What do Bollinger Bands help identify?
What is the Parabolic SAR used for?
What does the Ichimoku Cloud indicate?
Who developed the Japanese candlestick method?
What does a candlestick represent?
What influenced price movements according to Homma Munehisa?
What is the significance of candlestick patterns?
Who popularized Japanese candlestick charting in the Western world?
What is the purpose of candlestick patterns in trading?
What does a Doji candlestick indicate?
What is a Hammer candlestick pattern?
What does a Hanging Man pattern suggest?
What are Engulfing Patterns?
What is a Bullish Engulfing pattern?
What is a Bearish Engulfing pattern?
What is a Morning Star pattern?
What is an Evening Star pattern?
What is the Dark Cloud Cover pattern?
What does the Dark Cloud Cover indicate?
What is the Piercing Line pattern?
What does the Piercing Line indicate?
How are candlestick patterns used in Forex trading?
What type of pattern is the Dark Cloud Cover?
What type of pattern is the Piercing Line?
What is the significance of combining patterns with other tools?
What is the number given in the input?
What is the anatomy of candlesticks in trading?
Why are candlestick patterns important?
What do you learn about candlestick patterns?
What is the market structure?
How do you identify trending markets?
What are support and resistance in trading?
What is top down analysis in trading?
Why is multiple time frame analysis important?
What is the pin bar strategy?
What do you learn about trading strategies and tactics?
What is the engulfing bar strategy?
What is the inside bar strategy?
What is the inside bar false breakout strategy?
Why is it important to master the basics before using advanced strategies?
What will you learn about high probability setups?
What is the focus of the money management section?
What are candlestick patterns used for in trading?
What is the significance of trending markets in trading strategies?
What is the significance of ranging markets in trading strategies?
What is a key element of a risk control plan?
When did the Japanese start using candlestick charts?
When did the earliest known charts in the US appear?
What commodity trading was established in Japan in 1654?
What commodities followed rice trading in Japan?
Who is credited as an early exponent of candlestick analysis?
What did Munehisa Homma understand about market dynamics?
What status was Munehisa Homma promoted to?
When did the Western world become aware of candlesticks?
What technological advancement helped in the rise of charting in the 1980s?
Which UK analyst was interested in candlesticks in the late 1980s?
Who introduced candlestick analysis to London professionals?
What magazine featured Steve Nison's paper on candlestick reversal patterns?
What did Steve Nison write a book about?
Why are candlesticks important for trading analysis?
What information can you derive from a candlestick?
What technical analysis tools can candlesticks be combined with?
What psychological factors does candlestick analysis help to understand?
How do candlesticks compare to bar charts?
What does a candlestick visually represent in the market?
What trading signals can candlesticks provide?
What do candlesticks provide in trading?
Who primarily uses candlesticks?
What can professional traders do in the market?
What is a risk of not understanding trading?
What can you not control with a $100,000 trading account?
How do candlestick patterns help traders?
What do candlestick patterns indicate?
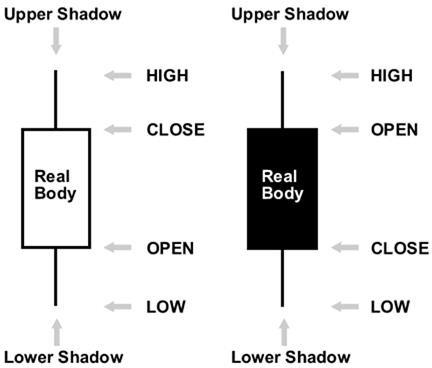
What is a candlestick?
What does the upper shadow of a candlestick represent?
What does the lower shadow of a candlestick represent?
What is the real body of a candlestick?
What indicates a bullish candlestick?
What color is typically used for bullish candlesticks?
What indicates a bearish candlestick?
What color is typically used for bearish candlesticks?
What is the significance of open and close prices in candlesticks?
Where can you find a visual representation of candlestick components?
What are the different parts of a candlestick?
What does a long body in a bullish candlestick indicate?
What does a long body in a bearish candlestick indicate?
What do short bodies in candlesticks indicate?
What are the shadows of a candlestick?
What is the high in a candlestick?
What is the low in a candlestick?
What is indicated by a candlestick with a close above the open?
What is indicated by a candlestick with an open above the close?
What can you find in the chart comparing long and short candlesticks?
What do upper shadows in candlesticks signify?
What do lower shadows in candlesticks signify?
What does a candlestick with long shadows indicate?
What does a long upper shadow and short lower shadow indicate?
What does a long lower shadow and short upper shadow indicate?
What do Japanese candlesticks with short shadows indicate?
What does a candlestick with a longer upper shadow suggest about buyers?
What does a candlestick with a long lower shadow suggest about sellers?
What is shown in the chart with long upper and lower shadows?
What are candlestick patterns?
What is the predictive value of candlestick patterns?
How long has the author been trading candlestick patterns?
What is the author's view on a 100% winning system?
What do candlestick patterns represent in the market?
What skill does understanding candlestick patterns improve?
What should you focus on regarding candlestick patterns?
Are candlestick patterns a holy grail for trading?
What is a common outcome of trading candlestick patterns?
What should you do if you can't read candlestick patterns?
What will the next chapters explain about candlestick patterns?
What is the skill you need to identify in the market?
What does identifying patterns in the market help you understand?
What will you be ready to master after acquiring pattern identification skills?
What will the upcoming chapters teach you?
Why is identifying market patterns important?
What is the definition of an engulfing bar candlestick pattern?
What is the bearish engulfing pattern?
What does a bearish engulfing bar indicate in the market?
How many candles must be engulfed for a pattern to be considered an engulfing bar?
What is the characteristic of the first body in a bearish engulfing pattern?
What visual information does a bearish engulfing bar provide?
What does the bearish engulfing bar look like?
What does a bearish engulfing bar pattern indicate?
When does a bearish engulfing bar pattern typically occur?
What does a bearish engulfing bar pattern signal?
What happens to buyers during a bearish engulfing bar pattern?
Can you trade any bearish candlestick pattern found on your chart?
What is essential to confirm entries in bearish candlestick patterns?
What does the bearish engulfing bar pattern show in an uptrend?
What is depicted in the provided chart?
What is the bullish engulfing bar pattern?
What does a bullish engulfing bar indicate in an uptrend?
What does a bullish engulfing candle at the end of a downtrend represent?
What are the components of a bullish engulfing bar?
What happens to market control during a bullish engulfing bar?
What does a bullish engulfing bar indicate?
What is the significance of the smaller body in a bullish engulfing bar?
Is the color of the bodies in a bullish engulfing bar important?
Should you trade solely based on a bullish engulfing bar?
What is the first step in trading with engulfing bars?
What does the bullish engulfing bar pattern look like?
What does a Doji candlestick indicate about market control?
What does it mean when the opening price equals the closing price in a Doji?
What is a potential outcome of a Doji pattern in an uptrend or downtrend?
What are the key components labeled in a Doji candlestick chart?
What is the significance of the Doji candlestick pattern?
What does the Doji candlestick pattern represent in trading?
Where can you find a visual example of a Doji candlestick?
What does a Doji candlestick indicate in the market?
What happens to the price after a Doji candlestick forms?
Where is a Doji candlestick typically found?
What does it mean if a Doji appears after a significant price movement?
What market condition does a Doji suggest after an uptrend?
What is the significance of a Doji in technical analysis?
What is depicted in the chart related to Doji candlestick?
What should you do if you are already riding a trend?
How can the trend be used in trading?
What is the Dragonfly Doji pattern?
What characterizes the Dragonfly Doji?
What does the long lower tail of a Dragonfly Doji suggest?
What signals a bullish reversal in trading?
What are the price levels in a Dragonfly Doji?
What is the visual representation of a Dragonfly Doji?
What does the dragonfly Doji candlestick pattern indicate?
What does the long lower tail of the dragonfly Doji signify?
In what market condition is the dragonfly Doji primarily interpreted as a bullish reversal signal?
What should traders use alongside the dragonfly Doji for better trading decisions?
Where can you visually identify when support and demand are located?
What happens to the market when it tests a previous support level?
What is the significance of the chart showing a dragonfly Doji?
What is a Gravestone Doji?
How does a Gravestone Doji differ from a dragonfly Doji?
What does the long upper tail of a Gravestone Doji indicate?
In the Gravestone Doji, what do the open and close prices represent?
What type of market signal does a Gravestone Doji provide?
What is the formation of a Gravestone Doji?
What is the visual representation of a Gravestone Doji?
What does a Gravestone Doji indicate?
Where should a Gravestone Doji occur for it to be reliable?
What does the long tail in a Gravestone Doji represent?
What is the significance of a Gravestone Doji at the top of an uptrend?
What is illustrated in the chart provided?
What is a gravestone Doji?
Why is the placement of the gravestone Doji important?
What does a gravestone Doji signal?
What should traders consider with a gravestone Doji?
What is the context of the gravestone Doji?
What is the significance of confirmation after a gravestone Doji?
What does a long upper shadow in a gravestone Doji indicate?
What is the morning star pattern?
What does the first candlestick in the morning star indicate?
What does the second candle in the morning star represent?
What characterizes the third candle in the morning star?
What does the morning star pattern signify about market control?
Where does the morning star pattern typically occur?
What type of market trend does the morning star indicate?
What type of candles can the second candle in the morning star be?
What is the significance of the third candle closing above the midpoint of the first day's body?
What visual representation can help understand the morning star pattern?
What does a downtrend near a support level indicate?
What is the morning star pattern?
What does the first candle in the morning star pattern indicate?
What does the second candle in the morning star pattern represent?
What type of candle can the second candle be in a morning star pattern?
What is the significance of the morning star pattern in trading?
In the context of the morning star pattern, what does a bearish candle indicate?
In the context of the morning star pattern, what does a bullish candle indicate?
What does the chart illustrating the morning star pattern help identify?
What is the AUDCHF daily range mentioned?
What does the presence of a small bullish candle in the morning star pattern suggest?
How is a morning star pattern formed?
What role does indecision play in the morning star pattern?
Where is the morning star pattern typically found?
What does the chart of the morning star pattern illustrate?
What does a Doji candle indicate in trading?
What does the third bullish candle signify?
How do professional traders analyze the market?
What is essential to master for analyzing financial markets?
What is the evening star pattern?
How many candles are in the evening star pattern?
What is the first candle in the evening star pattern?
What type of candle is the second candle in the evening star pattern?
What is the third candle in the evening star pattern?
What does the evening star pattern signify in trading?
How does the evening star pattern compare to the morning star pattern?
What does the evening star pattern look like?
What does the first candle in an evening star pattern signify?
What does the second candle in an evening star pattern represent?
What does the third candle in an evening star pattern indicate?
What is the overall implication of the evening star pattern?
What does the formation of a smaller body in the evening star pattern suggest?
How does the evening star pattern typically start?
What visual representation helps illustrate the evening star pattern?
What does a long bullish candlestick indicate?
What happens when the final candlestick gaps lower than the previous one?
What does losing momentum in a bullish trend suggest?
What is a sign of a trend reversal in candlestick analysis?
What can indicate the beginning of a new trend down?
What is the significance of candlestick patterns in trading?
What is a Hammer candlestick?
What does a long lower shadow in a Hammer candlestick indicate?
When is a Hammer candlestick considered a reversal pattern?
What are the characteristics of a Hammer candlestick?
What is the significance of the Hammer candlestick in trading?
How does a Hammer candlestick appear visually?
What is a hammer candlestick pattern?
What does a long shadow in a hammer pattern indicate?
What is the body of a hammer candlestick like?
What does the formation of a hammer signify?
What is the psychology behind the hammer candlestick pattern?
How does a hammer candlestick relate to market trends?
What does it mean when buyers are more powerful than sellers in a hammer pattern?
What can be predicted with high accuracy using this method?
What will be discussed in the next chapters?
What is a shooting star in candlestick analysis?
What does the long shadow of a shooting star indicate?
In what market condition does a shooting star signal a bearish reversal?
What is the ideal ratio of the shadow length to the body length in a shooting star?
What are the key components of a shooting star candlestick?
What does a shooting star formation suggest about market sentiment?
What is the closing price in a shooting star pattern?
What does the opening price represent in a shooting star?
How is a shooting star visually represented on a candlestick chart?
What does the shooting star pattern indicate about buying pressure?
What does a shooting star look like in a candlestick chart?
What does a shooting star candlestick pattern indicate?
Where should a shooting star candlestick form for it to be significant?
What can the shooting star pattern be used with?
Why is the shooting star pattern considered powerful?
What is a bearish pin bar in relation to the shooting star?
What is the main characteristic of a shooting star candlestick?
What type of market signal does the shooting star provide?
What is essential for confirming the shooting star pattern?
What does the chart showing a shooting star look like?
What will be shown step by step?
What is the Harami pattern?
What does the first candle in the Harami pattern represent?
What does the second candle in the Harami pattern represent?
What is required for the Harami pattern to be valid?
What does a Harami pattern indicate when it occurs at the top of an uptrend?
What does a Harami pattern indicate when it occurs at the bottom of a downtrend?
What is another name for the Harami pattern?
What is depicted in this image? 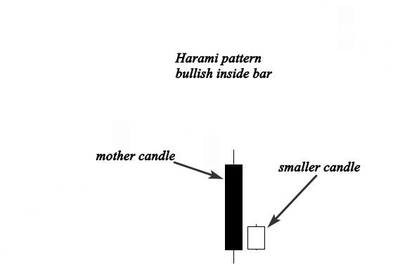
What is a Harami pattern?
What does the smaller body in a Harami pattern signify?
What does a Harami pattern indicate when it occurs during an uptrend?
What is the importance of colors in a Harami pattern?
What does the Harami candle tell us about the market?
What is the mother bar in a Harami pattern?
What is a bearish inside bar?
What is the visual representation of a Harami pattern?
What is a bullish Harami pattern?
What does a bearish Harami indicate?
What happens after a bullish Harami formation?
What does the Harami pattern indicate during a trend?
Where can you see the bullish Harami pattern in the chart?
What is the opposite of a bullish Harami?
How does the market behave after a bearish Harami?
What will be discussed in the next chapters regarding the Harami pattern?
What is the tweezers top formation?
What is the tweezers bottom formation?
What do the candles in a tweezers bottom represent?
How is the tweezers top pattern identified?
How is the tweezers bottom pattern identified?
What is the significance of tweezers patterns in trading?
What type of market trend does a tweezers top suggest?
What type of market trend does a tweezers bottom suggest?
What are the two types of candles in a tweezers bottom?
Where can you see a tweezers top formation?
Where can you see a tweezers bottom formation?
What does a bearish candle indicate in a tweezers pattern?
What does a bullish candle indicate in a tweezers pattern?
What visual representation can help identify tweezers patterns?
What is the importance of identifying tweezers patterns?
What is depicted in the image related to tweezers bottom?
What is a bullish candle?
What is a bearish candle?
What is a Tweezer Top?
What does a Tweezer Bottom indicate?
What occurs during the Tweezer Top formation?
What occurs during the Tweezer Bottom formation?
What is the significance of the Tweezer Top?
What is the significance of the Tweezer Bottom?
What is the structure of a Tweezer Top?
What is the structure of a Tweezer Bottom?
How can traders use the Tweezer patterns?
What does the Tweezer Top pattern suggest about market sentiment?
What does the Tweezer Bottom pattern suggest about market sentiment?
What is the visual representation of a Tweezer Top?
What is the visual representation of a Tweezer Bottom?
What does a bearish candle near a support level indicate?
What is a Tweezers Bottom?
What should you focus on when analyzing candlestick patterns?
What indicates a reversal buy signal in a Tweezers Bottom?
What do bears do in a downtrend before a Tweezers Bottom forms?
What is essential to confirm before trading a Tweezers Bottom?
What does the chart showing a Tweezers Bottom illustrate?
Why is it important to understand the formation of a market?
What can you easily predict if you understand why the market was formed?
What is the anatomy of a candlestick?
What does a long body in a candlestick indicate?
What does a short body in a candlestick suggest?
What is a doji candlestick?
What does a bullish engulfing pattern signify?
What does a bearish engulfing pattern indicate?
What is the psychology behind a hammer candlestick?
What does a shooting star candlestick indicate?
What is the significance of wicks in candlesticks?
What is the importance of candlestick patterns in trading?
Identify the candlestick pattern shown in the chart image.
What does the Bullish Harami pattern indicate?
What does the Bullish Tweezers pattern represent?
What does an Engulfing bar signify?
What does the Harami pattern show?
What is the candlestick pattern for number 1?
What is the candlestick pattern for number 2?
What is the candlestick pattern for number 3?
What is a bullish engulfing bar?
What should you focus on before learning market entry and exit techniques?
What will help you identify entry and exit points in trading?
What is the goal of practicing candlestick patterns?
How can screen time and practice affect trading skills?
What transformation can occur from using price action strategies?
What should you do repeatedly to master candlestick patterns?
What is the significance of the bullish engulfing bar in trading?
What is the first step before focusing on market entries and exits?
What is the benefit of mastering candlestick patterns for traders?
What is the importance of market structure for traders?
What does market structure study?
What are the key questions to answer when analyzing market structure?
What are the three types of markets experienced in price action analysis?
What characterizes trending markets?
What is a key feature of an up-trending market?
What is a key feature of a down-trending market?
Why is it important to study market movements?
What should traders do to master market structure?
What are the characteristics of an uptrend?
What does a series of higher highs and higher lows indicate?
How can you determine if the market is bullish or bearish?
What are the characteristics of a downtrend?
What does a series of lower highs and lower lows indicate?
What is the EURUSD price action for the uptrend example?
What is the EURUSD price action for the downtrend example?
What visual representation can show an uptrend?
What visual representation can show a downtrend?
What indicates a bearish market?
How can you identify a trending market?
What percentage of the time do trends occur according to statistics?
What time frames should you use to determine market trends?
Should you use smaller time frames to determine market structure?
What is a characteristic of an uptrend market?
What is a characteristic of a downtrend market?
What should you do while a trend is in motion?
What is the importance of using bigger time frames?
What should you avoid when analyzing market trends?
What is the first step in trading a trending market?
In a bullish market, what should you look for?
In a bearish market, what should you look for?
What are the two important moves in trending markets?
What does an impulsive move indicate?
What does a retracement move signify?
In the example of EURUSD, what indicates a bullish market?
What should you do when you identify a trending market?
What is the key characteristic of a trending market?
What type of chart is useful for visualizing trends?
What are the two moves in a trending market?
When do professional traders buy in a trending market?
What do professional traders do at the end of an impulsive move?
What happens after an impulsive move in the market?
Why do traders get caught during a retracement?
What is the best place to buy in a trending market?
What do traders often misunderstand about stop losses?
What is a bearish trend?
What is an impulsive move in trading?
What is a retracement in trading?
What should you do at the beginning of an impulsive move in a downtrend?
What happens if you sell during a retracement?
How can you identify downtrends and uptrends?
Why is it important for price action traders to distinguish between impulsive moves and retracements?
What is the most important question for traders regarding impulsive moves?
What visual aid can help identify impulsive moves and retracements?
What are support levels in trading?
What are resistance levels in trading?
How do you draw support levels on a chart?
How do you draw resistance levels on a chart?
Why are support and resistance levels important?
What is the impulsive move in a trending market?
What should you master to predict impulsive moves?
What are support and resistance levels?
How are support and resistance levels formed?
What happens in a trending market regarding support and resistance?
In an uptrend, what acts as a support level?
In a downtrend, what acts as a resistance level?
What can be seen in the example of EURUSD?
What does the previous swing point act as after a breakout?
What happens when the market retraces to the previous swing point?
How can we predict the next impulsive move in an uptrend market?
What does the market respect when it approaches the previous swing point in a downtrend?
What is the significance of the previous swing point in trading?
What is the chart type used to illustrate swing points and resistance levels?
In the context of GBPUSD, what are the swing point values mentioned?
What does a downtrend market indicate in trading?
What is the role of resistance levels in a downtrend market?
What visual representation is provided in the example?
What is the effect of testing a resistance level in the market?
What does the term 'swing point' refer to in trading?
What does the illustration show about the market's behavior at swing points?
What is illustrated in the provided candlestick chart?
What is a breakout in trading?
What is an impulsive move in market terms?
What does the market do after testing a support level?
What can be predicted by observing previous swing points in an uptrend?
What does the term 'resistance level' signify in trading?
What is the relationship between swing points and market trends?
What does the market do during an impulsive move?
How can you predict the next impulsive move?
What is one method to catch the beginning of an impulsive move?
What is a trend line?
What do bullish markets create in terms of trend lines?
What do bearish markets form in terms of trend lines?
What is the significance of swing highs and lows in the market?
What skill is essential for identifying key support and resistance levels?
What does it mean for price to respect a trend line?
What is the role of trend lines in a trending market?
What is the minimum number of swing points needed to draw a trend line?
What time frames should you use to draw trend lines?
What is the purpose of drawing trend lines in trending markets?
Should trend lines be forced?
In a downtrend, what does the market do when it approaches the trend line?
What is an example of a currency pair in a downtrend?
What are the specific price levels mentioned for USDCHF in a downtrend?
What should you focus on when drawing trend lines?
What will be explained in the next chapter?
What do trend lines help us anticipate in the market?
What is an example of a market trend discussed?
What do trend lines allow us to predict?
What should you look for when analyzing trending markets?
What exercise is suggested for understanding trending markets?
What is the importance of drawing trend lines correctly?
What do you need to find to understand how trending markets move?
What does the market respect according to the text?
What is a ranging market?
What are the characteristics of a ranging market?
What happens when a market stops making higher highs and higher lows?
What is the difference between trending and ranging markets?
What is the support level in a ranging market?
What is the resistance level in a ranging market?
What does a chart of a ranging market look like?
What do ranging markets tend to do?
What is crucial for using price action strategies effectively?
What happens in a ranging market?
What occurs when range structures break out?
Where do the best buying and selling opportunities occur in ranging markets?
What are the three ways to trade ranging markets?
What skill is important when analyzing charts?
What will be covered in the next chapters?
What is a key characteristic of trading in ranging markets?
Where are the best buying opportunities in a ranging market?
Where are the best selling opportunities in a ranging market?
What is a breakout in trading?
What does a breakout indicate about a ranging market?
What should you pay attention to in a ranging market?
What happens when a player takes control of the market?
What is the significance of support and resistance levels?
What is the visual representation of a ranging market?
What is the current EURUSD price?
What are the high and low prices for EURUSD?
What indicates a beginning of a trend in trading?
What can be deceptive in trading breakouts?
What is a pullback in trading?
What should traders do after a breakout?
What is a resistance level?
What is a support level?
What happens when the price breaks out of a resistance level?
What should traders be cautious of during a breakout?
What is the best way to enter the market after a breakout?
What is shown in the example provided?
What does the term breakout refer to in trading?
What happens to resistance after a breakout?
When does a ranging market occur?
What should you focus on in a ranging market?
What does a breakout indicate?
What is the significance of a pullback after a breakout?
What is the risk associated with a breakout?
What is the price range mentioned for GBPUSD?
What is the date range mentioned in the chart for GBPUSD?
What does the chart illustrate?
What should you do if you miss the breakout?
How can you identify if a market is worth trading?
What indicates a choppy market in Forex?
What feelings might arise in a choppy market?
How can you determine if a market is choppy?
What is a common characteristic of choppy markets?
What is an example of a choppy chart?
What can help you identify a choppy market more easily?
What does a lot of noise in a chart indicate?
What should you do when you feel you can't identify market boundaries?
What is the best practice after missing a breakout?
What can cause a drop in performance in trading?
What is the importance of identifying market conditions?
What can excessive noise in a chart lead to?
What should you look for in a market to avoid choppy conditions?
What is a visual cue of a choppy market?
What does choppy price action indicate in a market?
Should you trade in a choppy market?
What happens if you trade in a choppy market?
What often occurs after a market makes big moves?
What does a tight range in price action suggest?
What is the primary time frame for price action trading?
Why should you avoid trading on the 5-minute time frame?
What is the concept of top down analysis in trading?
What should you analyze before trading the 4H chart?
What should you analyze before trading the 1H chart?
What information do you gather during top down analysis?
What do support and resistance levels indicate in trading?
What happens when price approaches support and resistance levels?
What is a critical step for price action traders?
What is the risk of focusing on a single time frame in trading?
What does the weekly analysis help identify?
Why is the previous candle on the weekly chart important?
What can be analyzed on the daily chart or 4h chart?
What are key levels to identify on the 4h or daily time frame?
What is a price action signal?
What is the top-down analysis concept in trading?
What can happen if you don't analyze the bigger time frame before trading?
What does the weekly chart indicate about the market?
What is the highest resistance level mentioned?
What is the lowest resistance level mentioned?
What indicates a rejection from resistance in the market?
What pattern confirms a potential reversal in the market?
What is a risk when trading near resistance levels?
What was the date range of the analysis provided?
What does a false breakout indicate?
What should traders look for on the daily time frame?
What is the significance of the price levels listed?
What is the major weekly level mentioned in the data?
What indicates a bullish signal on the daily chart?
What should you do if you analyze the weekly chart?
What is the buy signal level listed in the data?
What is the lowest level listed in the data?
What is the highest level listed in the data?
What does a clear pin bar signal suggest for trading?
What is the key level that might stop the market from going up?
What is the date range for the major weekly levels?
What does the bullish trend indicate in trading?
What is the importance of top down analysis in trading?
What happened to the bullish candlestick signal after the market reached the weekly turning point?
Why is trading based on one-time frame not recommended?
What can happen when trading counter trends without top down analysis?
What is a pin bar candlestick signal?
What does the weekly resistance level represent in trading?
What is the risk of ignoring top down analysis?
What is the significance of the weekly level in trading?
What is the date range mentioned in the trading example?
What type of chart is referenced in the example?
What is a proven weekly turning point in trading?
What does it mean when price is at major resistance?
How can traders identify a potential selling opportunity?
What indicates that the market is at a hot point?
What is the significance of the chart provided?
What should be the next step after identifying resistance?
What does the weekly chart indicate about price movements?
What is the date range shown in the example chart?
What does a rejection at resistance imply?
What is the first step to take when price is at resistance?
What does a high probability setup mean?
What can traders conclude from historical price levels?
What is the importance of looking to the left on the chart?
What does the image in the example depict?
What is the major reversal level indicated in the chart?
What is the bearish reversal level indicated in the chart?
What candlestick signal is observed near the resistance level?
What pattern indicates a potential trend change?
What is the lowest level recorded in the daily chart?
What does the daily chart confirm about the weekly analysis?
What is the significance of the pin bar in the analysis?
What does a false breakout suggest in trading?
When was the highest level reached in the daily chart?
What does a bearish signal near a resistance level imply?
What is the date range of the data presented in the chart?
What does the term weekly resistance level refer to?
What trend change is indicated by the daily chart analysis?
What is a major reversal level?
What does the term Huge Reversal indicate?
What is the importance of mastering counter trend trading?
What is recommended for beginners in trading?
What is the top down analysis approach in trading?
How can keeping analysis simple benefit traders?
What should traders do to improve their skills?
What is the date of the highest major reversal level listed?
What is the lowest major reversal level recorded?
How can traders time market turns?
What should traders focus on to trade the right way?
What does a candlestick chart show?
What is the first step in identifying market trends?
How can market trends be identified?
What might be confusing at the beginning of market trend analysis?
What is essential for becoming proficient in identifying market trends?
What should you expect when first learning to identify market trends?
What will help you find it easy to identify market direction?
What are the three important aspects of price action trading?
How do you identify the market trend?
What should you do if the market is choppy?
What are the two boundaries in a ranging market?
What are support and resistance levels used for?
What is the first question to answer when analyzing a chart?
What is an uptrend?
What is a downtrend?
What do you look for in a trending market?
What is the purpose of drawing trend lines?
What is the key to making money in trading?
How can you differentiate between trending markets and range bound markets?
What does a consolidating market indicate?
What is the role of psychology in candlestick patterns?
What is a powerful level in trading?
What should you do if the market is trending up?
What should you do if the market is trending down?
What are the best zones for buying and selling in the market?
What does the best signal to enter the market indicate?
What will you learn in the next chapter?
What is the pin bar candlestick pattern used for?
What characterizes a pin bar?
What does the long tail of a pin bar indicate?
What is the area between the open and close of a pin bar called?
What is a Bullish pin bar characterized by?
What is a Bearish pin bar characterized by?
Which color of a bullish candle is considered more powerful?
Which color of a bearish pin bar is more significant?
What is the visual appearance of a Bullish Pin Bar?
What is a bearish pin bar?
What does the real body of a candlestick represent?
What is a long tail in a pin bar candlestick?
How to identify pin bar candlestick setups?
What is the significance of a pin bar near a support level?
Why are quality price action setups rare in the market?
What happens if buyers' investment is less than sellers' in a pin bar setup?
What is the law of supply and demand in trading?
What should you do when you identify a quality pin bar candle?
What does a bearish pin bar indicate in an uptrend?
What is the visual representation of a bearish pin bar?
What happens if the market does not go in your predicted direction?
Why is it important to look for quality pin bar setups?
What is a key mindset of successful traders?
Which time frames should be considered for pin bar setups?
Why should smaller time frames be ignored for pin bar setups?
What does it mean if a pin bar setup fails?
What is trading fundamentally about?
What should you do when a signal fails?
What is the importance of evaluating pin bar setups?
What is a pin bar in trading?
When is a pin bar more powerful?
What does a clear trend indicate in the market?
Why is a pin bar formation with the trend effective?
What is the significance of the chart shown?
What should you do with bullish pin bars formed in line with the uptrend?
What should you do with bearish pin bars formed against the trend?
What is important to check in the anatomy of a pin bar?
What characteristic of pin bars makes them more powerful?
What do pin bars indicate about price action?
Where should you watch for pin bar formations?
What does a rejection near a support level indicate?
What does the formation of a pin bar near key levels signify?
What does a pin bar signal indicate near a resistance level?
What happens when a pin bar forms at a support level?
What do bears do when a pin bar forms near a resistance level?
What do sellers indicate when a pin bar forms at a resistance level?
What is the significance of a pin bar in trading?
What visual representation is used to analyze a pin bar signal?
What is a pin bar signal?
What does understanding pin bar psychology help with?
What is the significance of resistance levels?
What is the price action in relation to pin bars?
What are the components of a pin bar?
How can a trader use a pin bar signal?
What does a long wick on a pin bar indicate?
What is the importance of psychology in trading pin bars?
What is the first step to trade based on pin bar signals?
What should traders consider when analyzing a pin bar?
Why should beginners trade with the trend?
What should you identify before trading a pin bar?
What does a pin bar signal when it occurs at a support or resistance level?
What is the risk/reward ratio when trading pin bars with the trend?
What is the first step in the pin bar trading strategy?
What occurs after identifying a trend in pin bar trading?
What does the example of GOLD show in the context of pin bar trading?
What should you do after mastering trading with the trend?
What does the retracement move indicate in pin bar trading?
What is the significance of a pin bar at a resistance level?
What is depicted in the candlestick chart example provided?
What is the next step after identifying a pin bar signal?
What does a successful pin bar trade require?
What is the goal of trading pin bars?
What is the importance of waiting for a pullback in pin bar trading?
What is the key focus when trading pin bars?
What does the formation of a pin bar indicate?
What are the criteria for a high-quality setup?
What role does the 21-moving average play in trading?
What does a resistance level indicate in a downtrend?
What is a major key level in trading?
When is it difficult to draw support and resistance levels?
What currency pair is represented in the first chart?
What is the value of USDCHF at the time of the analysis?
What moving average is mentioned as acting as a resistance level?
What trading signal is indicated in the USDCHF chart?
What trend is the USDCHF market currently in?
What does the 21 moving average help identify in trading?
What is the value of EURUSD at the time of the analysis?
What is the trend of the EURUSD market indicated in the chart?
What trading signal is indicated in the EURUSD chart?
What does the 21 moving average indicate in the EURUSD chart?
What is the significance of a pin bar signal in trading?
What is the importance of moving averages in trading?
What does a pin bar signal in a downtrend suggest?
What time frame is used for the analysis of USDCHF and EURUSD?
What is the highest value of USDCHF in the analysis?
What is the lowest value of USDCHF in the analysis?
What is the highest value of EURUSD in the analysis?
What is the lowest value of EURUSD in the analysis?
What date is indicated in the EURUSD analysis?
What is the chart showing in the first image?
What is the chart showing in the second image?
What does the 21-moving average help identify in the market?
What happens when prices approach the moving average?
What signal is clear when the trend is bullish?
What does a rejection from the 21-moving average indicate?
What anatomy does the price action setup have when bullish?
What does the pin bar signal indicate in a bullish trend?
What is the effect of buying pressure on prices?
In a bullish trend, what does the 21-moving average act as?
What is the first step in trading tactics?
What should you look for near support or resistance levels?
What is the aggressive entry option in trading pin bars?
Why use the aggressive entry option?
What is shown in the example with AUDCAD?
What happens if you don't enter the market after the pin bar closes?
What influences the entry options for trading pin bars?
What does the pin bar indicate in trading?
What is the importance of stop loss in trading?
What does the chart in the example illustrate?
What are the three important elements for executing a trade?
What should be done after the close of the pin bar?
Where should your profit target be in a downtrend?
What is the conservative entry option?
What risk/reward ratio can the conservative entry option provide?
What is the risk of the conservative entry option?
What does a clear pin bar signal indicate?
What happens when the market is trending down?
What does a support level becoming resistance signify?
What is the importance of the three elements in trading?
What currency pair is being analyzed in the chart?
What is the current price of NZD/USD in the analysis?
What trend is indicated in the market analysis?
What is a significant technical feature mentioned in the analysis?
What does S.L stand for in trading?
What candlestick pattern is noted in the analysis?
What is the purpose of a retracement in trading?
What is the risk/reward ratio mentioned for the trade?
How often is one trade like this suggested to generate decent income?
What does the illustration suggest about conservative entries?
What type of chart is used in the analysis?
What does the illustration provide insight into?
What is the entry point suggested in the analysis?
What is one trade's potential to generate income according to the analysis?
What is depicted in the accompanying image?
What does 'support becomes resistance' mean in trading?
What is a '50% pin bar'?
What is a 'retracement' in trading?
What is the significance of the 'entry' point in trading?
What is a 'stop loss' in trading?
What is a drawback of the 50% pin bar entry option?
How can experience influence trading decisions?
What is the visual representation of 'support becomes resistance'?
What is confluence in trading?
Why is trading with confluence important?
What does confluence mean?
What is the first factor of confluence to consider?
How does a bearish pin bar perform in a downtrend?
What role do support and resistance levels play in confluence?
What moving averages does the author use for confluence?
What Fibonacci levels are used for confluence?
Flashcards in this deck (882)
-
What does Forex stand for?
Forex stands for foreign exchange.
forex definition -
What is the purpose of Forex trading?
To buy and sell currencies aiming to make a profit from exchange rate changes.
forex trading -
What is the size of the Forex market?
The largest and most liquid financial market in the world.
forex market -
When does the Forex market operate?
24 hours a day, five days a week.
forex trading_hours -
Who participates in Forex trading?
Traders, investors, banks, corporations, and governments.
forex participants -
What influences exchange rates in Forex?
Economic indicators, geopolitical events, and market sentiment.
forex exchange_rates -
When did the modern Forex market begin to take shape?
In the 1970s.
forex history -
What caused the shift to floating exchange rates?
The collapse of the Bretton Woods Agreement in 1971.
forex history -
What role does the Forex market play in the global economy?
Facilitates international trade and investment.
forex economy -
How does Forex differ from stock markets?
Forex operates 24/5, while stock markets have specific trading hours.
forex comparison -
What is one key feature of the Forex market?
It has high liquidity, allowing quick entry and exit of positions.
forex liquidity -
What is a significant advantage of Forex trading?
High leverage allowing control of large positions.
forex leverage -
What is a broker in the Forex market?
A broker is a financial firm that acts as an intermediary between traders and the interbank market, providing access to the Forex market.
forex brokers -
What is a trading platform?
A trading platform is software provided by brokers that allows traders to access the Forex market, analyze data, place trades, and manage accounts.
forex trading platforms -
What are the popular trading platforms in Forex?
Popular trading platforms include MetaTrader 4 (MT4) and MetaTrader 5 (MT5), known for their user-friendly interface and extensive capabilities.
forex trading platforms -
What are currency pairs in Forex trading?
Currency pairs are financial instruments consisting of two currencies, with one being bought (base currency) and the other sold (quote currency).
forex currency pairs -
What is an example of a currency pair?
In the EUR/USD pair, the Euro is the base currency and the US Dollar is the quote currency.
forex currency pairs -
What determines the exchange rate of a currency pair?
The exchange rate represents how much of the quote currency is needed to buy one unit of the base currency.
forex exchange rate -
What types of currency pairs exist in Forex?
There are major currency pairs, minor pairs, and exotic pairs, each with different levels of liquidity and volatility.
forex currency pairs -
What is the mindset of a successful trader?
A successful trader must be disciplined, patient, and have a well-defined trading plan.
forex trading mindset -
Why is discipline important in trading?
Discipline involves consistently following a set of rules and strategies, even amidst market fluctuations or emotional responses.
forex trading discipline -
What role does patience play in trading?
Patience is essential for making trading decisions based on thorough analysis rather than impulsive reactions to market movements.
forex trading patience -
What should a trading plan define?
A trading plan should define goals, risk tolerance, and strategies for entering and exiting trades.
forex trading plan -
What are key traits of successful traders?
- Resilience
- Adaptability
- Continuous desire to learn and improve
trading traits -
What is Day Trading?
Buying and selling financial instruments within the same trading day to profit from small price movements.
trading strategies -
What is Swing Trading?
Holding positions for a few days to weeks to capture short to medium-term gains.
trading strategies -
What is Trend Trading?
Identifying and following an established trend (bullish or bearish) to make profitable trades.
trading strategies -
What is Scalping Trading?
Making numerous small trades to profit from small price movements in a short time, often seconds to minutes.
trading strategies -
What is the goal of Scalping Trading?
To accumulate many small gains that add up to a larger profit over time.
trading strategies -
What is Range Trading?
Identifying support and resistance levels to buy at support and sell at resistance.
trading strategies -
What is Breakout Trading?
Entering positions when the price breaks through significant support or resistance levels to capture strong price movements.
trading strategies -
What does VSA stand for in trading?
Volume Spread Analysis.
trading vsa -
How does VSA differ from candlestick analysis?
VSA focuses on volume-based trades and not all candlestick rules apply.
trading vsa -
What is essential for developing a successful trading mindset?
Navigating challenges and achieving long-term success in the Forex market.
trading mindset -
What indicates the entry of smart money into the market?
Smart money enters the market when there is a significant increase in volume, particularly very high or ultra high volume.
trading smart_money -
What is the volume confirmation method for trading?
Confirm volume as very high or ultra high by checking if it breaks the high of at least 15 to 20 previous volumes.
trading volume -
What are two types of volume to consider for trading?
- Very high volume
- Ultra high volume
trading volume_types -
What are charting platforms used for?
Charting platforms like TradingView or MetaTrader provide detailed price charts and technical analysis indicators.
trading charting -
What role does news and market analysis play in trading?
Access to news sources like Bloomberg and Reuters helps traders stay informed about market trends and events.
trading news -
What is the purpose of trading platforms?
Trading platforms like Thinkorswim and E*TRADE allow traders to place trades and manage positions.
trading platforms -
What are technical analysis indicators used for?
Indicators like moving averages and RSI help analyze price movements and identify potential entry and exit points.
trading technical_analysis -
What do fundamental analysis tools analyze?
Fundamental analysis tools evaluate company financials, economic data, and industry trends for informed trading decisions.
trading fundamental_analysis -
What are risk management tools in trading?
Risk management tools include stop-loss orders, position sizing calculators, and risk-reward ratio calculators.
trading risk_management -
What are candlesticks used for in trading?
Candlesticks visually represent price movements, showing opening, closing, high, and low prices for a specific time period.
trading candlesticks -
What does the body of a candlestick represent?
The body represents the price range between the opening and closing prices.
trading candlesticks -
What color indicates a price increase in candlesticks?
Green or white indicates a price increase.
trading candlesticks -
What color indicates a price decrease in candlesticks?
Red or black indicates a price decrease.
trading candlesticks -
What do the wicks of a candlestick represent?
Wicks represent the high and low prices reached during the time period.
trading candlesticks -
What are the two types of indicators in trading?
Leading indicators and lagging indicators.
trading indicators -
What is the purpose of leading indicators?
Leading indicators aim to predict future price movements based on historical data.
trading indicators -
What is a Moving Average?
A Moving Average smooths out price data to identify trends over time.
trading indicators -
What does the Relative Strength Index (RSI) measure?
RSI measures the speed and change of price movements, indicating overbought or oversold conditions.
trading indicators -
What does the Stochastic Oscillator compare?
It compares a security's closing price to its price range over a specific period.
trading indicators -
What does MACD stand for?
MACD stands for Moving Average Convergence Divergence.
trading indicators -
What can MACD help identify?
MACD helps identify changes in strength, direction, momentum, and duration of a trend.
trading indicators -
Why should leading indicators be combined with other techniques?
Combining leading indicators with other analysis techniques creates a comprehensive trading strategy.
trading strategy -
What are lagging indicators in trading?
Lagging indicators are tools that follow price movements and help analyze trends based on historical data.
trading indicators -
What is the purpose of Moving Averages?
They smooth out price data to identify trends over time and follow price movements.
trading moving_averages -
What do Bollinger Bands consist of?
A moving average and two standard deviation lines above and below the moving average.
trading bollinger_bands -
What do Bollinger Bands help identify?
Overbought and oversold conditions in the market.
trading bollinger_bands -
What is the Parabolic SAR used for?
It provides potential entry and exit points while following price movements.
trading parabolic_sar -
What does the Ichimoku Cloud indicate?
It provides information about support and resistance levels, trend direction, and momentum.
trading ichimoku_cloud -
Who developed the Japanese candlestick method?
Homma Munehisa, a Japanese rice trader in the 17th century.
trading candlesticks -
What does a candlestick represent?
It visually depicts the open, high, low, and close prices for a specific time period.
trading candlesticks -
What influenced price movements according to Homma Munehisa?
Emotions and psychology, in addition to supply and demand factors.
trading psychology -
What is the significance of candlestick patterns?
They allow traders to quickly assess market sentiment and potential price direction.
trading candlestick_patterns -
Who popularized Japanese candlestick charting in the Western world?
Steve Nison in the 1980s
history trading -
What is the purpose of candlestick patterns in trading?
To analyze and predict price movements
trading analysis -
What does a Doji candlestick indicate?
Indecision in the market
candlestick forex -
What is a Hammer candlestick pattern?
A small body with a long lower wick, signals potential reversal at the bottom of a downtrend.
candlestick forex -
What does a Hanging Man pattern suggest?
Possible reversal at the top of an uptrend
candlestick forex -
What are Engulfing Patterns?
Two candles where the second engulfs the body of the first, indicating potential trend reversals.
candlestick trading -
What is a Bullish Engulfing pattern?
When a second candle engulfs a first bearish candle, indicating a potential upward trend.
candlestick trading -
What is a Bearish Engulfing pattern?
When a second candle engulfs a first bullish candle, indicating a potential downward trend.
candlestick trading -
What is a Morning Star pattern?
A bullish reversal pattern found at the bottom of a downtrend, formed by three candles.
candlestick trading -
What is an Evening Star pattern?
A bearish reversal pattern found at the top of an uptrend, formed by three candles.
candlestick trading -
What is the Dark Cloud Cover pattern?
A bearish reversal pattern where a red candle follows a bullish green candle, signaling a potential downturn.
trading candlestick patterns -
What does the Dark Cloud Cover indicate?
It indicates a potential downturn in the market.
trading candlestick indicators -
What is the Piercing Line pattern?
A bullish reversal pattern that occurs after a downtrend.
trading candlestick patterns -
What does the Piercing Line indicate?
It indicates a potential bullish reversal after a downtrend.
trading candlestick indicators -
How are candlestick patterns used in Forex trading?
Traders combine them with other technical analysis tools to make informed decisions.
trading candlestick forex -
What type of pattern is the Dark Cloud Cover?
Bearish reversal pattern.
trading candlestick patterns -
What type of pattern is the Piercing Line?
Bullish reversal pattern.
trading candlestick patterns -
What is the significance of combining patterns with other tools?
It helps traders make well-informed trading decisions.
trading analysis strategies -
What is the number given in the input?
6
numbers -
What is the anatomy of candlesticks in trading?
Candlesticks have different body sizes, indicating market psychology. Understanding these sizes is crucial for trading.
trading candlesticks -
Why are candlestick patterns important?
They are integral to technical analysis, as they reflect human actions and reactions that are patterned and repeated.
trading patterns -
What do you learn about candlestick patterns?
You learn to recognize important patterns, understand their formation psychology, and their market implications.
trading patterns -
What is the market structure?
It includes trending, ranging, and choppy markets, which affect trading strategies.
trading marketstructure -
How do you identify trending markets?
By analyzing price movements and determining the direction of market flow.
trading marketstructure -
What are support and resistance in trading?
Support is a price level where buying interest overcomes selling pressure, while resistance is where selling pressure overcomes buying interest.
trading support resistance -
What is top down analysis in trading?
It involves analyzing the market from higher time frames to lower ones to make informed trading decisions.
trading analysis -
Why is multiple time frame analysis important?
It helps price action traders make better decisions by providing a comprehensive view of market trends.
trading analysis -
What is the pin bar strategy?
A price action trading strategy that uses pin bars to identify potential reversals in the market.
trading strategies -
What do you learn about trading strategies and tactics?
You learn to trade using specific strategies focused on price action, including the pin bar strategy.
trading strategies -
What is the engulfing bar strategy?
A candlestick pattern where a larger candle engulfs the previous smaller candle, indicating a potential reversal in the market direction.
trading strategies -
What is the inside bar strategy?
A trading strategy that uses a candlestick pattern where the current candle is within the range of the previous candle, signaling potential continuation or reversal.
trading strategies -
What is the inside bar false breakout strategy?
A strategy that identifies false breakouts from an inside bar pattern, allowing traders to enter trades when the price reverses after a breakout.
trading strategies -
Why is it important to master the basics before using advanced strategies?
Mastering the basics ensures a solid foundation, enabling effective use of advanced trading strategies and better decision-making.
trading education -
What will you learn about high probability setups?
How to identify high probability setups in the market using candlestick patterns in both trending and ranging markets.
trading strategies -
What is the focus of the money management section?
Creating a money management and risk control plan to protect trading capital and achieve consistent profitability.
trading money_management -
What are candlestick patterns used for in trading?
They are used to predict future price movements and identify potential entry and exit points in the market.
trading candlesticks -
What is the significance of trending markets in trading strategies?
Trending markets provide opportunities for traders to capitalize on sustained price movements, enhancing potential profits.
trading market_analysis -
What is the significance of ranging markets in trading strategies?
Ranging markets allow traders to exploit price fluctuations within established support and resistance levels.
trading market_analysis -
What is a key element of a risk control plan?
Determining the maximum amount of capital to risk on each trade to protect overall trading capital.
trading risk_management -
When did the Japanese start using candlestick charts?
17th century
history candlesticks -
When did the earliest known charts in the US appear?
Late 19th century
history charts -
What commodity trading was established in Japan in 1654?
Rice trading
history japan rice -
What commodities followed rice trading in Japan?
Gold, silver, rape seed oil
history commodities -
Who is credited as an early exponent of candlestick analysis?
Munehisa Homma (Sokyu Honma)
history candlesticks munehisa_homma -
What did Munehisa Homma understand about market dynamics?
Supply and demand, and the role of emotion
history economics candlesticks -
What status was Munehisa Homma promoted to?
Samurai status
history japan samurai -
When did the Western world become aware of candlesticks?
1980s
history candlesticks western_world -
What technological advancement helped in the rise of charting in the 1980s?
Widespread use of PCs
history technology charting -
Which UK analyst was interested in candlesticks in the late 1980s?
Michael Feeny
history candlesticks michael_feeny -
Who introduced candlestick analysis to London professionals?
Sumitomo
trading candlesticks -
What magazine featured Steve Nison's paper on candlestick reversal patterns?
Futures magazine (December 1989)
trading candlesticks -
What did Steve Nison write a book about?
Candlestick analysis
trading candlesticks -
Why are candlesticks important for trading analysis?
They provide a visual representation of market activity.
trading candlesticks -
What information can you derive from a candlestick?
Open, high, low, and close prices.
trading candlesticks -
What technical analysis tools can candlesticks be combined with?
- Moving averages
- Momentum oscillators
- Dow Theory
- Elliott Wave Theory
trading technical_analysis -
What psychological factors does candlestick analysis help to understand?
- Fear
- Greed
- Hope
trading psychology -
How do candlesticks compare to bar charts?
They provide more valuable information.
trading candlesticks -
What does a candlestick visually represent in the market?
The interaction between buyers and sellers.
trading candlesticks -
What trading signals can candlesticks provide?
They can indicate price movements and trends.
trading signals -
What do candlesticks provide in trading?
Candlesticks generate added clarity and additional signals for traders.
trading candlesticks -
Who primarily uses candlesticks?
Most professional traders, banks, and hedge funds use candlesticks.
trading professionals -
What can professional traders do in the market?
They can move the market and trade millions of dollars daily.
trading market -
What is a risk of not understanding trading?
You can easily lose money to professional traders.
trading risk -
What can you not control with a $100,000 trading account?
You can't move the market or control market actions.
trading account -
How do candlestick patterns help traders?
They help understand what major players are doing in the market.
trading candlesticks -
What do candlestick patterns indicate?
They show when to enter, exit, or stay away from the market.
trading strategy -
What is a candlestick?
A candlestick represents price movements in a chosen time frame using open, high, low, and close prices.
trading candlestick -
What does the upper shadow of a candlestick represent?
The upper shadow shows the highest price reached during the time period.
trading candlestick -
What does the lower shadow of a candlestick represent?
The lower shadow shows the lowest price reached during the time period.
trading candlestick -
What is the real body of a candlestick?
The real body shows the difference between the open and close prices.
trading candlestick -
What indicates a bullish candlestick?
A bullish candlestick occurs when the close price is above the open price.
trading candlestick -
What color is typically used for bullish candlesticks?
Bullish candlesticks are usually displayed as white.
trading candlestick -
What indicates a bearish candlestick?
A bearish candlestick occurs when the close price is below the open price.
trading candlestick -
What color is typically used for bearish candlesticks?
Bearish candlesticks are usually displayed as black.
trading candlestick -
What is the significance of open and close prices in candlesticks?
Open and close prices are crucial as they determine if the candlestick is bullish or bearish.
trading candlestick -
Where can you find a visual representation of candlestick components?
 trading candlestick visual
 -
What are the different parts of a candlestick?
- Real body: Filled part of the candlestick
- Shadows: Thin lines above and below the body
- High: Top of the upper shadow
- Low: Bottom of the lower shadow
finance candlesticks -
What does a long body in a bullish candlestick indicate?
Strong buying pressure; buyers are taking control of the market.
finance candlesticks bullish -
What does a long body in a bearish candlestick indicate?
Strong selling pressure; sellers are controlling the market.
finance candlesticks bearish -
What do short bodies in candlesticks indicate?
Little buying or selling activity.
finance candlesticks -
What are the shadows of a candlestick?
The thin lines poking above and below the real body.
finance candlesticks -
What is the high in a candlestick?
The top of the upper shadow.
finance candlesticks -
What is the low in a candlestick?
The bottom of the lower shadow.
finance candlesticks -
What is indicated by a candlestick with a close above the open?
It indicates bullish market conditions.
finance candlesticks bullish -
What is indicated by a candlestick with an open above the close?
It indicates bearish market conditions.
finance candlesticks bearish -
What can you find in the chart comparing long and short candlesticks?
Differences in body sizes and their implications for market control.
finance candlesticks -
What do upper shadows in candlesticks signify?
They signify the session high.
trading candlesticks -
What do lower shadows in candlesticks signify?
They signify the session low.
trading candlesticks -
What does a candlestick with long shadows indicate?
It shows that trading action occurred well past the open and close.
trading candlesticks -
What does a long upper shadow and short lower shadow indicate?
It means buyers pushed the price higher, but sellers drove it back down near the open price.
trading candlesticks -
What does a long lower shadow and short upper shadow indicate?
It means sellers pushed the price lower, but buyers drove it back up near the open price.
trading candlesticks -
What do Japanese candlesticks with short shadows indicate?
They indicate that most trading action was confined near the open and close.
trading candlesticks -
What does a candlestick with a longer upper shadow suggest about buyers?
It suggests that buyers flexed their muscles and bid price higher.
trading candlesticks -
What does a candlestick with a long lower shadow suggest about sellers?
It suggests that sellers forced the price lower.
trading candlesticks -
What is shown in the chart with long upper and lower shadows?
It visually represents the session highs and lows in trading.
trading candlesticks -
What are candlestick patterns?
Candlestick patterns are powerful trading concepts that are simple, easy to identify, and profitable setups.
trading candlestick -
What is the predictive value of candlestick patterns?
Research has confirmed that candlestick patterns have a high predictive value and can produce positive results.
trading candlestick -
How long has the author been trading candlestick patterns?
The author has been trading candlestick patterns for more than 20 years.
trading experience -
What is the author's view on a 100% winning system?
The author states that if you are looking for a 100% winning system, you should stop trading and find another business.
trading advice -
What do candlestick patterns represent in the market?
Candlestick patterns are the language of the market, indicating market dynamics and trader behavior.
trading market -
What skill does understanding candlestick patterns improve?
Understanding candlestick patterns improves your ability to enter and exit the market at the right time.
trading skills -
What should you focus on regarding candlestick patterns?
Focus on the anatomy of the pattern and the psychology behind its formation.
trading psychology -
Are candlestick patterns a holy grail for trading?
No, the author does not introduce candlestick patterns as a holy grail but as a working system.
trading myth -
What is a common outcome of trading candlestick patterns?
Be prepared to lose some trades; losing is a part of trading.
trading losses -
What should you do if you can't read candlestick patterns?
If you can't read candlestick patterns, it's tough to navigate the market effectively.
trading understanding -
What will the next chapters explain about candlestick patterns?
The next chapters will explain how to trade candlestick patterns in detail.
trading learning -
What is the skill you need to identify in the market?
The skill of identifying patterns in the market.
trading skills -
What does identifying patterns in the market help you understand?
It helps you understand what to do next in trading.
trading strategy -
What will you be ready to master after acquiring pattern identification skills?
You will be ready to master trading strategies and tactics.
trading mastery -
What will the upcoming chapters teach you?
They will teach you trading strategies and tactics.
trading education -
Why is identifying market patterns important?
It guides your next steps in trading decisions.
trading importance -
What is the definition of an engulfing bar candlestick pattern?
An engulfing bar pattern is formed when it fully engulfs the previous candle. At least one candle must be fully consumed to be considered an engulfing bar.
candlestick patterns -
What is the bearish engulfing pattern?
The bearish engulfing pattern consists of two bodies: the first body is smaller than the second, which engulfs the previous one.
candlestick bearish patterns -
What does a bearish engulfing bar indicate in the market?
A bearish engulfing bar indicates a potential reversal from bullish to bearish sentiment in the market.
candlestick bearish market -
How many candles must be engulfed for a pattern to be considered an engulfing bar?
At least one candle must be fully consumed for the pattern to be considered an engulfing bar.
candlestick patterns -
What is the characteristic of the first body in a bearish engulfing pattern?
The first body in a bearish engulfing pattern is smaller than the second body.
candlestick bearish patterns -
What visual information does a bearish engulfing bar provide?
It provides valuable information about the balance of bulls and bears in the market.
candlestick bearish market -
What does the bearish engulfing bar look like?
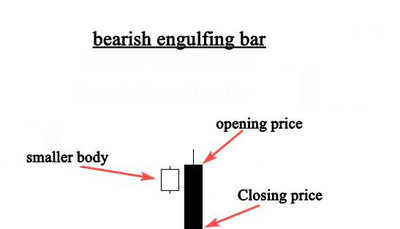 candlestick bearish visual
 -
What does a bearish engulfing bar pattern indicate?
Sellers are in control of the market.
trading candlestick -
When does a bearish engulfing bar pattern typically occur?
At the end of an uptrend.
trading candlestick -
What does a bearish engulfing bar pattern signal?
A trend reversal.
trading candlestick -
What happens to buyers during a bearish engulfing bar pattern?
Buyers are engulfed by sellers.
trading candlestick -
Can you trade any bearish candlestick pattern found on your chart?
No, you need other technical tools to confirm entries.
trading candlestick -
What is essential to confirm entries in bearish candlestick patterns?
Other technical tools.
trading candlestick -
What does the bearish engulfing bar pattern show in an uptrend?
Sellers are trying to push the market down.
trading candlestick -
What is depicted in the provided chart?
A bearish engulfing bar pattern.
trading candlestick -
What is the bullish engulfing bar pattern?
It consists of two candlesticks: a small body followed by an engulfing candle.
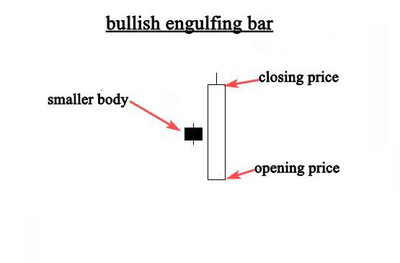 trading candlestick patterns
 -
What does a bullish engulfing bar indicate in an uptrend?
It indicates a continuation signal, suggesting buyers will take control.
trading candlestick patterns -
What does a bullish engulfing candle at the end of a downtrend represent?
It represents a powerful reversal, indicating a capitulation bottom.
trading candlestick patterns -
What are the components of a bullish engulfing bar?
- Small body (first candlestick)
- Engulfing candle (second candlestick)
trading candlestick patterns -
What happens to market control during a bullish engulfing bar?
The market shifts from sellers to buyers taking control.
trading candlestick patterns -
What does a bullish engulfing bar indicate?
It indicates a potential market direction change after the formation of the pattern.
trading patterns -
What is the significance of the smaller body in a bullish engulfing bar?
The smaller body represents selling power that is completely covered by the larger body, which represents buying power.
trading patterns -
Is the color of the bodies in a bullish engulfing bar important?
No, the color is not important; the key is that the smaller body is fully engulfed by the larger body.
trading patterns -
Should you trade solely based on a bullish engulfing bar?
No, you need other factors of confluence to decide whether the pattern is worth trading.
trading patterns -
What is the first step in trading with engulfing bars?
The first step is to develop the skill of identifying bullish and bearish engulfing bars on your charts.
trading patterns -
What does the bullish engulfing bar pattern look like?
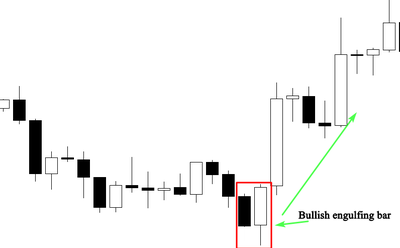 trading charts
 -
What does a Doji candlestick indicate about market control?
It indicates that there is equality and indecision between buyers and sellers, with no one in control of the market.
trading candlestick -
What does it mean when the opening price equals the closing price in a Doji?
It means the market didn't decide which direction to take.
trading candlestick -
What is a potential outcome of a Doji pattern in an uptrend or downtrend?
It indicates that the market is likely to reverse.
trading candlestick -
What are the key components labeled in a Doji candlestick chart?
- Highest price
- Closing price
- Opening price
- Lowest price
trading candlestick -
What is the significance of the Doji candlestick pattern?
It signals market indecision and potential reversal points.
trading candlestick -
What does the Doji candlestick pattern represent in trading?
It represents a balance between buying and selling pressure.
trading candlestick -
Where can you find a visual example of a Doji candlestick?
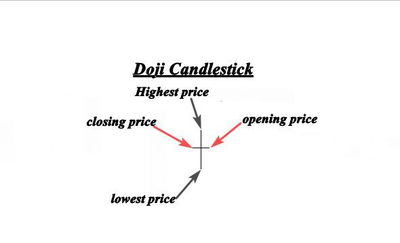 trading candlestick
 -
What does a Doji candlestick indicate in the market?
It indicates indecision and equality in the market, suggesting a potential trend reversal.
trading candlestick -
What happens to the price after a Doji candlestick forms?
The price often returns to the opening price, indicating sellers are gaining control.
trading candlestick -
Where is a Doji candlestick typically found?
At the top or bottom of a trend, signaling a potential loss of strength in the prior trend.
trading candlestick -
What does it mean if a Doji appears after a significant price movement?
It often signifies a resting period after big moves, indicating indecision in the market.
trading candlestick -
What market condition does a Doji suggest after an uptrend?
It suggests that buyers are unable to maintain higher prices, hinting at a possible reversal.
trading candlestick -
What is the significance of a Doji in technical analysis?
It is a clear indication that a trend reversal is likely to happen.
trading technical_analysis -
What is depicted in the chart related to Doji candlestick?
The chart shows how the market changed direction after the formation of the Doji candlestick.
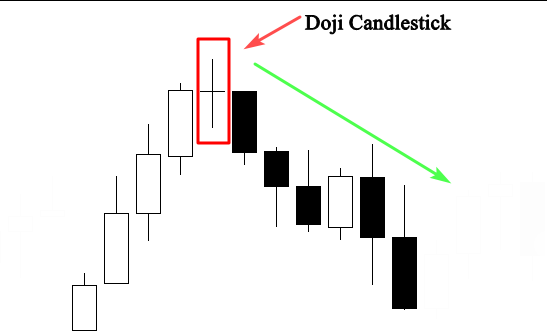 trading candlestick chart
 -
What should you do if you are already riding a trend?
It's time to take profits.
trading strategy -
How can the trend be used in trading?
It can serve as an entry signal when combined with other technical analysis.
trading analysis -
What is the Dragonfly Doji pattern?
A bullish candlestick pattern formed when the open, high, and close are the same or nearly the same price.
trading candlestick -
What characterizes the Dragonfly Doji?
It has a long lower tail indicating buyer resistance and an attempt to push the market up.
trading candlestick -
What does the long lower tail of a Dragonfly Doji suggest?
It suggests that the forces of supply and demand are nearing a balance, indicating a potential trend reversal.
trading candlestick -
What signals a bullish reversal in trading?
A Dragonfly Doji can indicate a bullish reversal signal.
trading candlestick -
What are the price levels in a Dragonfly Doji?
- Closing price: same as opening price
- Opening price: same as closing price
- Long tail: indicates buyer activity
trading candlestick -
What is the visual representation of a Dragonfly Doji?
It is represented by a candlestick with a long lower tail and little to no upper shadow.
trading candlestick -
What does the dragonfly Doji candlestick pattern indicate?
It indicates high buying pressure and potential bullish reversal when in a downtrend.
trading candlestick patterns -
What does the long lower tail of the dragonfly Doji signify?
It signifies strong rejection from a support level and high buying pressure.
trading candlestick patterns -
In what market condition is the dragonfly Doji primarily interpreted as a bullish reversal signal?
In a downtrend.
trading candlestick patterns -
What should traders use alongside the dragonfly Doji for better trading decisions?
Other indicators and tools to determine high probability signals.
trading candlestick patterns -
Where can you visually identify when support and demand are located?
By identifying the dragonfly Doji candlestick pattern on your chart.
trading candlestick patterns -
What happens to the market when it tests a previous support level?
It can cause a strong rejection from that area.
trading support market -
What is the significance of the chart showing a dragonfly Doji?
It highlights the candlestick pattern and its implications for trading.
trading candlestick charts -
What is a Gravestone Doji?
A bearish candlestick pattern formed when the open and close are the same or about the same price, characterized by a long upper tail.
candlestick trading -
How does a Gravestone Doji differ from a dragonfly Doji?
The Gravestone Doji has a long upper tail, while the dragonfly Doji does not.
candlestick trading -
What does the long upper tail of a Gravestone Doji indicate?
It indicates that the market is testing a powerful supply or resistance area.
candlestick analysis -
In the Gravestone Doji, what do the open and close prices represent?
They are the same or about the same price.
candlestick trading -
What type of market signal does a Gravestone Doji provide?
It provides a bearish signal, indicating potential price declines.
candlestick trading -
What is the formation of a Gravestone Doji?
It consists of a long upper shadow, a small body at the bottom, and little to no lower shadow.
candlestick formation -
What is the visual representation of a Gravestone Doji?
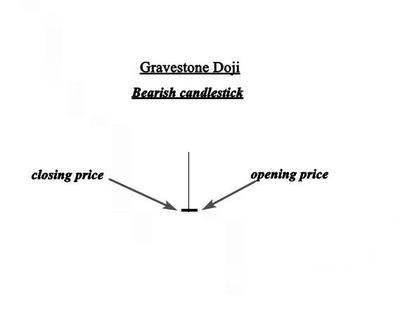 candlestick visual
 -
What does a Gravestone Doji indicate?
It indicates that buyers pushed prices above the open, but sellers overwhelmed the market, suggesting bulls are losing momentum and a reversal may occur.
trading candlestick patterns -
Where should a Gravestone Doji occur for it to be reliable?
Near a resistance level.
trading candlestick patterns -
What does the long tail in a Gravestone Doji represent?
It represents the price movement where buyers pushed prices up before sellers brought it back down.
trading candlestick patterns -
What is the significance of a Gravestone Doji at the top of an uptrend?
It indicates that buyers are no longer in control of the market.
trading candlestick patterns -
What is illustrated in the chart provided?
A Gravestone Doji candlestick pattern.
trading candlestick patterns -
What is a gravestone Doji?
A candlestick pattern indicating indecision in the market, characterized by a small body at the bottom and long upper shadow.
trading candlestick -
Why is the placement of the gravestone Doji important?
Placement helps determine the strength of the signal and its context within the trend.
trading analysis -
What does a gravestone Doji signal?
It signals potential reversal or indecision after an uptrend.
trading signals -
What should traders consider with a gravestone Doji?
Traders should consider the preceding trend, volume, and confirmation from subsequent candles.
trading strategy -
What is the context of the gravestone Doji?
Context refers to its position in relation to previous price action and market conditions.
trading context -
What is the significance of confirmation after a gravestone Doji?
Confirmation from following candles increases the reliability of the reversal signal.
trading confirmation -
What does a long upper shadow in a gravestone Doji indicate?
It indicates that buyers pushed prices higher but sellers regained control, leading to indecision.
trading candlestick -
What is the morning star pattern?
A bullish reversal pattern occurring at the bottom of a downtrend, consisting of three candlesticks.
trading patterns -
What does the first candlestick in the morning star indicate?
It is bearish, indicating that sellers are still in charge of the market.
trading candlesticks -
What does the second candle in the morning star represent?
A small candle indicating sellers are in control but not pushing the market much lower; it can be bullish or bearish.
trading candlesticks -
What characterizes the third candle in the morning star?
A bullish candlestick that gaps up on the open and closes above the midpoint of the first day's body.
trading candlesticks -
What does the morning star pattern signify about market control?
It shows how buyers took control of the market from sellers.
trading market_control -
Where does the morning star pattern typically occur?
At the bottom of a downtrend.
trading patterns -
What type of market trend does the morning star indicate?
A potential bullish reversal.
trading reversal -
What type of candles can the second candle in the morning star be?
It can be either bullish or bearish.
trading candlesticks -
What is the significance of the third candle closing above the midpoint of the first day's body?
It holds a significant trend reversal signal.
trading signals -
What visual representation can help understand the morning star pattern?
A diagram of the morning star candlestick pattern, showing bearish and bullish candles.
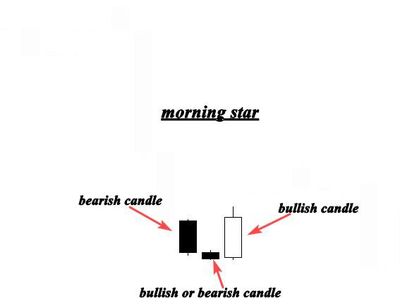 trading visuals
 -
What does a downtrend near a support level indicate?
It is interpreted as a powerful trend reversal signal.
trading analysis -
What is the morning star pattern?
A candlestick pattern significant when formed at the bottom of a downtrend.
trading candlestick -
What does the first candle in the morning star pattern indicate?
It confirms the seller's domination.
trading candlestick -
What does the second candle in the morning star pattern represent?
It produces indecision in the market; could be a Doji or other candle.
trading candlestick -
What type of candle can the second candle be in a morning star pattern?
It could be a Doji or any other candle.
trading candlestick -
What is the significance of the morning star pattern in trading?
It signals a potential reversal from a downtrend to an uptrend.
trading patterns -
In the context of the morning star pattern, what does a bearish candle indicate?
It indicates seller dominance before the reversal pattern forms.
trading candlestick -
In the context of the morning star pattern, what does a bullish candle indicate?
It indicates potential buyer strength after the reversal pattern forms.
trading candlestick -
What does the chart illustrating the morning star pattern help identify?
It helps identify the significance of the pattern during a downtrend.
trading charting -
What is the AUDCHF daily range mentioned?
0.75373 to 0.75658, with a low of 0.75227 and close of 0.75501.
forex audchf -
What does the presence of a small bullish candle in the morning star pattern suggest?
It suggests indecision and a potential shift in market sentiment.
trading candlestick -
How is a morning star pattern formed?
It is formed by three candles: a bearish candle, a small body candle, and a bullish candle.
trading patterns -
What role does indecision play in the morning star pattern?
It indicates a potential reversal in market trend following a downtrend.
trading psychology -
Where is the morning star pattern typically found?
At the bottom of a downtrend, near a support level.
trading patterns -
What does the chart of the morning star pattern illustrate?
It highlights the significance of the pattern in identifying reversals.
trading charting -
What does a Doji candle indicate in trading?
Sellers are struggling to push the market lower.
trading candlestick -
What does the third bullish candle signify?
Buyers took control from sellers, indicating a potential market reversal.
trading candlestick -
How do professional traders analyze the market?
By using candlestick patterns and understanding the psychology behind their formations.
trading analysis -
What is essential to master for analyzing financial markets?
The anatomy of candlestick patterns and the psychology behind their formations.
trading education -
What is the evening star pattern?
A bearish reversal pattern that occurs at the top of an uptrend.
trading candlestick patterns -
How many candles are in the evening star pattern?
Three candlesticks.
trading candlestick patterns -
What is the first candle in the evening star pattern?
A bullish candle.
trading candlestick patterns -
What type of candle is the second candle in the evening star pattern?
A small candlestick, which can be bullish, bearish, or a Doji.
trading candlestick patterns -
What is the third candle in the evening star pattern?
A large bearish candle.
trading candlestick patterns -
What does the evening star pattern signify in trading?
It signifies a bearish reversal.
trading candlestick patterns -
How does the evening star pattern compare to the morning star pattern?
The evening star is the bearish version of the morning star pattern.
trading candlestick patterns -
What does the evening star pattern look like?
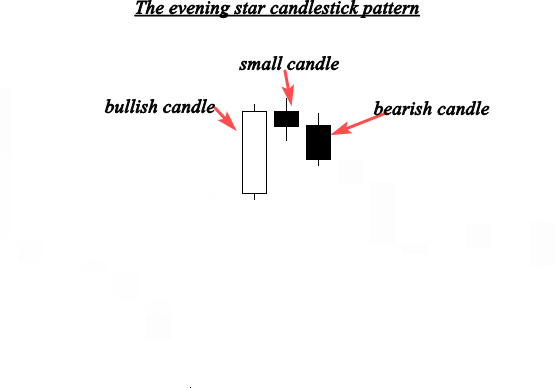 trading candlestick patterns
 -
What does the first candle in an evening star pattern signify?
A bullish candle, indicating that bulls are pushing the market higher.
trading candlestick -
What does the second candle in an evening star pattern represent?
A short candle, indicating price consolidation and indecision.
trading candlestick -
What does the third candle in an evening star pattern indicate?
A bearish candle, suggesting that buyer's domination is over and a bearish trend reversal may occur.
trading candlestick -
What is the overall implication of the evening star pattern?
It signals a potential trend reversal from bullish to bearish.
trading trend_reversal -
What does the formation of a smaller body in the evening star pattern suggest?
It shows that buyers are still in control but not as powerful as before.
trading candlestick -
How does the evening star pattern typically start?
With a long move up indicated by the first candle.
trading candlestick -
What visual representation helps illustrate the evening star pattern?
A chart highlighting an evening star pattern.
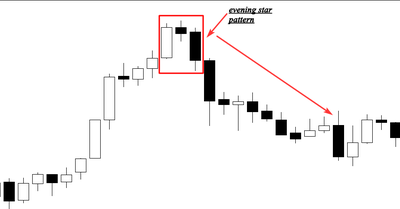 trading charts
 -
What does a long bullish candlestick indicate?
It indicates strong buying momentum in the market.
trading candlestick -
What happens when the final candlestick gaps lower than the previous one?
It confirms a reversal and signals the beginning of a new downtrend.
trading candlestick -
What does losing momentum in a bullish trend suggest?
It suggests a potential reversal in market direction.
trading momentum -
What is a sign of a trend reversal in candlestick analysis?
A final candlestick gaping lower than the previous one.
trading reversal -
What can indicate the beginning of a new trend down?
Confirmation of a reversal with a lower gaping candlestick.
trading trend -
What is the significance of candlestick patterns in trading?
They help traders identify potential market reversals or continuations.
trading candlestick -
What is a Hammer candlestick?
A Hammer candlestick is created when the open, high, and close are roughly the same price, characterized by a long lower shadow indicating bullish rejection from buyers.
trading candlestick -
What does a long lower shadow in a Hammer candlestick indicate?
It indicates a bullish rejection from buyers and their intention to push the market higher.
trading candlestick -
When is a Hammer candlestick considered a reversal pattern?
It is considered a reversal pattern when it occurs at the bottom of a downtrend.
trading candlestick -
What are the characteristics of a Hammer candlestick?
- Open, high, and close are roughly the same
- Long lower shadow
- Little to no upper shadow
trading candlestick -
What is the significance of the Hammer candlestick in trading?
It signals a potential reversal in price direction, indicating bullish market sentiment after a downtrend.
trading candlestick -
How does a Hammer candlestick appear visually?
It has a small body at the top, a long lower shadow, and little to no upper shadow.
trading candlestick -
What is a hammer candlestick pattern?
A candle that forms when sellers push the market lower after the open but buyers reject this, closing higher than the lowest price.
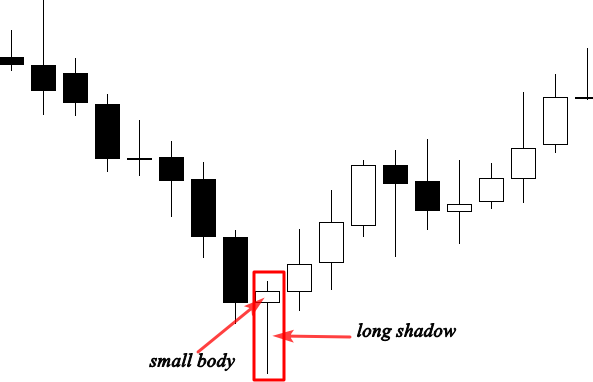 trading candlestick patterns
 -
What does a long shadow in a hammer pattern indicate?
It indicates high buying pressure, showing that buyers rejected lower prices after sellers attempted to push the market down.
trading candlestick psychology -
What is the body of a hammer candlestick like?
It is small, indicating a limited price movement during the trading period.
trading candlestick patterns -
What does the formation of a hammer signify?
It is a significant reversal pattern indicating a potential change in market direction from downtrend to uptrend.
trading reversal patterns -
What is the psychology behind the hammer candlestick pattern?
It reflects the struggle between buyers and sellers, where buyers overpower sellers at a certain price level, leading to a reversal.
trading psychology candlestick -
How does a hammer candlestick relate to market trends?
It usually appears after a downtrend, signaling a potential reversal in market direction.
trading trends reversal -
What does it mean when buyers are more powerful than sellers in a hammer pattern?
It indicates that buying pressure is strong enough to reverse the prevailing downtrend.
trading psychology candlestick -
What can be predicted with high accuracy using this method?
Market direction
trading market -
What will be discussed in the next chapters?
How to trade this pattern and filter the signal
trading strategy -
What is a shooting star in candlestick analysis?
A shooting star is a bearish pin bar characterized by a small body and a long upper shadow, formed when the open, low, and close are roughly the same price.
trading candlestick -
What does the long shadow of a shooting star indicate?
The long shadow indicates that buyers attempted to push the market higher but were rejected by selling pressure.
trading psychology -
In what market condition does a shooting star signal a bearish reversal?
A shooting star signals a bearish reversal when it occurs in an uptrend.
trading reversal -
What is the ideal ratio of the shadow length to the body length in a shooting star?
The shadow should be twice the length of the real body.
trading candlestick -
What are the key components of a shooting star candlestick?
- Small body
- Long upper shadow
- Open, low, and close at similar prices
trading candlestick -
What does a shooting star formation suggest about market sentiment?
It suggests that buyers are losing control and selling pressure is increasing.
trading market_sentiment -
What is the closing price in a shooting star pattern?
The closing price is roughly the same as the opening price, indicating little net movement.
trading candlestick -
What does the opening price represent in a shooting star?
The opening price is where the candle starts, close to the low and close price.
trading candlestick -
How is a shooting star visually represented on a candlestick chart?
It appears as a candle with a small body and a long upper shadow, typically at the top of an uptrend.
trading candlestick -
What does the shooting star pattern indicate about buying pressure?
It indicates that buying pressure was present but was overcome by selling pressure.
trading psychology -
What does a shooting star look like in a candlestick chart?
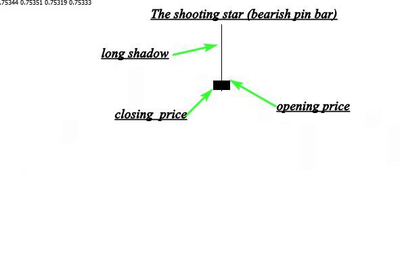 trading candlestick
 -
What does a shooting star candlestick pattern indicate?
It indicates the end of an uptrend and the beginning of a new downtrend.
candlestick trading -
Where should a shooting star candlestick form for it to be significant?
It should form near a resistance level.
candlestick trading -
What can the shooting star pattern be used with?
It can be used with support and resistance, supply and demand areas, and technical indicators.
candlestick trading -
Why is the shooting star pattern considered powerful?
It is easy to identify and can be very profitable for market entry.
candlestick trading -
What is a bearish pin bar in relation to the shooting star?
A bearish pin bar is another name for the shooting star candlestick pattern.
candlestick trading -
What is the main characteristic of a shooting star candlestick?
It forms at the end of an uptrend and has a long upper shadow with a small body.
candlestick patterns -
What type of market signal does the shooting star provide?
It provides a high probability setup for potential market reversal.
candlestick trading -
What is essential for confirming the shooting star pattern?
Confirmation through subsequent price action is essential for reliability.
candlestick trading -
What does the chart showing a shooting star look like?
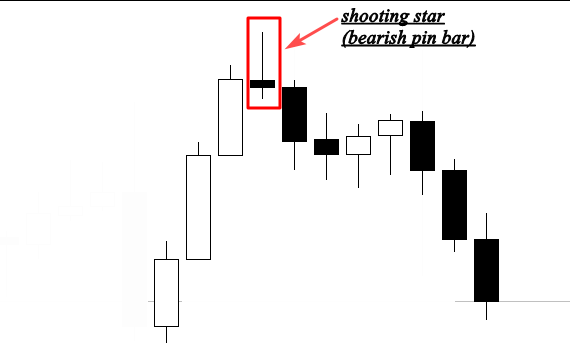 chart candlestick
 -
What will be shown step by step?
How to make money trading a price action pattern.
trading finance -
What is the Harami pattern?
A candlestick pattern consisting of a large candle (mother) followed by a smaller candle (baby).
trading candlestick -
What does the first candle in the Harami pattern represent?
The first candle is the large candle, called the mother candle.
trading candlestick -
What does the second candle in the Harami pattern represent?
The second candle is the smaller candle, called the baby.
trading candlestick -
What is required for the Harami pattern to be valid?
The second candle should close outside the previous one.
trading candlestick -
What does a Harami pattern indicate when it occurs at the top of an uptrend?
It is considered a bearish reversal signal.
trading candlestick -
What does a Harami pattern indicate when it occurs at the bottom of a downtrend?
It is considered a bullish signal.
trading candlestick -
What is another name for the Harami pattern?
It is known as the inside bar pattern.
trading candlestick -
What is depicted in this image?
The Harami pattern with the mother candle and smaller candle labeled.
trading candlestick -
What is a Harami pattern?
A bearish inside bar where the smaller body is totally covered by the previous mother candle, indicating market indecision.
trading candlestick patterns -
What does the smaller body in a Harami pattern signify?
It signifies indecision in the market, as it closes inside the previous bigger candle.
trading candlestick patterns -
What does a Harami pattern indicate when it occurs during an uptrend?
It is interpreted as a continuation pattern, suggesting a good opportunity to join the trend.
trading candlestick patterns -
What is the importance of colors in a Harami pattern?
The colors of the candles are not important; the key factor is that the smaller body closes inside the bigger candle.
trading candlestick patterns -
What does the Harami candle tell us about the market?
It indicates that the market is in a period of indecision or consolidation, with no clear control by buyers or sellers.
trading candlestick patterns -
What is the mother bar in a Harami pattern?
The mother bar is the larger candle that completely envelops the smaller body in the Harami pattern.
trading candlestick patterns -
What is a bearish inside bar?
It refers to a candlestick pattern where the smaller body is completely contained within the previous larger candle, indicating potential downward movement.
trading candlestick patterns -
What is the visual representation of a Harami pattern?
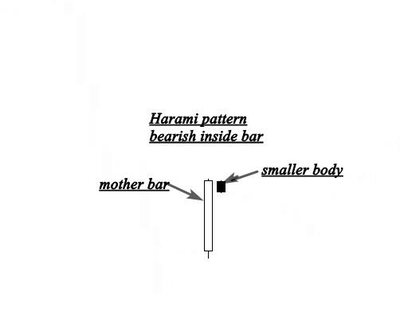 trading candlestick patterns
 -
What is a bullish Harami pattern?
A bullish Harami occurs at the bottom of a downtrend, indicating that selling power is weakening and a potential reversal may happen.
trading patterns -
What does a bearish Harami indicate?
A bearish Harami occurs at the top of an uptrend, suggesting that buyers are losing control and a downtrend may start.
trading patterns -
What happens after a bullish Harami formation?
After a bullish Harami, the trend direction typically changes, indicating a potential reversal from a downtrend to an uptrend.
trading patterns -
What does the Harami pattern indicate during a trend?
The Harami pattern can indicate a continuation signal in the direction of the market when formed during a trend.
trading patterns -
Where can you see the bullish Harami pattern in the chart?
The bullish Harami pattern is typically seen at the bottom of a downtrend as shown in the chart.
trading charts -
What is the opposite of a bullish Harami?
The opposite of a bullish Harami is a bearish Harami, which appears at the top of an uptrend.
trading patterns -
How does the market behave after a bearish Harami?
After a bearish Harami, the market may shift from an uptrend to a downtrend, indicating a potential reversal.
trading patterns -
What will be discussed in the next chapters regarding the Harami pattern?
The next chapters will cover how to trade the Harami pattern as either a reversal or a continuation pattern.
trading patterns -
What is the tweezers top formation?
A bearish reversal pattern seen at the top of an uptrend.
trading patterns -
What is the tweezers bottom formation?
A bullish reversal pattern seen at the bottom of a downtrend.
trading patterns -
What do the candles in a tweezers bottom represent?
- Bearish candle
- Bullish candle
trading candlestick -
How is the tweezers top pattern identified?
It appears at the end of an uptrend, indicating a potential reversal.
trading patterns -
How is the tweezers bottom pattern identified?
It appears at the end of a downtrend, indicating a potential reversal.
trading patterns -
What is the significance of tweezers patterns in trading?
They indicate potential reversal points in market trends.
trading analysis -
What type of market trend does a tweezers top suggest?
A potential bearish reversal in an uptrend.
trading trends -
What type of market trend does a tweezers bottom suggest?
A potential bullish reversal in a downtrend.
trading trends -
What are the two types of candles in a tweezers bottom?
- Bearish candle
- Bullish candle
trading candlestick -
Where can you see a tweezers top formation?
At the top of an uptrend.
trading patterns -
Where can you see a tweezers bottom formation?
At the bottom of a downtrend.
trading patterns -
What does a bearish candle indicate in a tweezers pattern?
It indicates selling pressure in the market.
trading candlestick -
What does a bullish candle indicate in a tweezers pattern?
It indicates buying pressure in the market.
trading candlestick -
What visual representation can help identify tweezers patterns?
Candlestick charts showing the arrangement of candles.
trading charts -
What is the importance of identifying tweezers patterns?
They help traders make informed decisions about market reversals.
trading strategy -
What is depicted in the image related to tweezers bottom?
A Tweezer Bottom pattern with labels for bearish and bullish candles.
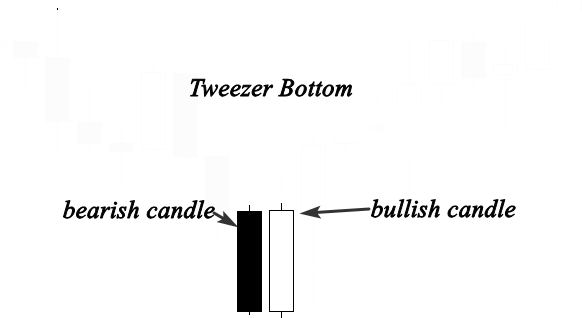 trading visuals
 -
What is a bullish candle?
A bullish candle indicates that the closing price is higher than the opening price, showing buying pressure in the market.
candlestick bullish -
What is a bearish candle?
A bearish candle indicates that the closing price is lower than the opening price, showing selling pressure in the market.
candlestick bearish -
What is a Tweezer Top?
A Tweezer Top is a candlestick pattern consisting of a bullish candle followed by a bearish candle, signaling a potential trend reversal.
candlestick tweezertop -
What does a Tweezer Bottom indicate?
A Tweezer Bottom is a candlestick pattern with a bearish candle followed by a bullish candle, signaling a potential trend reversal.
candlestick tweezerbottom -
What occurs during the Tweezer Top formation?
The Tweezer Top occurs during an uptrend, where buyers push prices higher, but sellers then push the market lower, closing below the bullish candle's open.
candlestick tweezertop -
What occurs during the Tweezer Bottom formation?
The Tweezer Bottom occurs during a downtrend, where sellers push prices lower, but the next session closes above the bearish candle's price.
candlestick tweezerbottom -
What is the significance of the Tweezer Top?
The Tweezer Top indicates a potential bullish trend reversal and can be traded when combined with other technical tools.
candlestick trendreversal -
What is the significance of the Tweezer Bottom?
The Tweezer Bottom indicates a potential bearish trend reversal and can be traded when combined with other technical tools.
candlestick trendreversal -
What is the structure of a Tweezer Top?
A Tweezer Top consists of two candlesticks: a bullish candle followed by a bearish candle.
candlestick tweezertop -
What is the structure of a Tweezer Bottom?
A Tweezer Bottom consists of two candlesticks: a bearish candle followed by a bullish candle.
candlestick tweezerbottom -
How can traders use the Tweezer patterns?
Traders can use Tweezer patterns to identify potential trend reversals when combined with other technical analysis tools.
trading technicalanalysis -
What does the Tweezer Top pattern suggest about market sentiment?
The Tweezer Top suggests that despite initial buying pressure, sellers have taken control, indicating a potential reversal.
marketsentiment tweezertop -
What does the Tweezer Bottom pattern suggest about market sentiment?
The Tweezer Bottom suggests that despite initial selling pressure, buyers have taken control, indicating a potential reversal.
marketsentiment tweezerbottom -
What is the visual representation of a Tweezer Top?
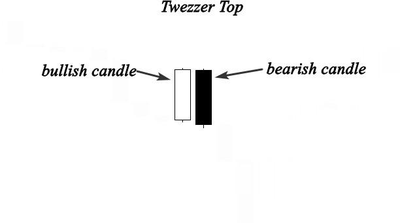 candlestick visual
 -
What is the visual representation of a Tweezer Bottom?
A visual representation of a Tweezer Bottom would show a bearish candle followed by a bullish candle, indicating reversal.
candlestick visual -
What does a bearish candle near a support level indicate?
It indicates that a bearish reversal is likely to happen.
trading candlestick -
What is a Tweezers Bottom?
It occurs in a downtrend where the second session opens at the close of the first and indicates a reversal buy signal.
trading candlestick -
What should you focus on when analyzing candlestick patterns?
Understand the psychology behind its formation, rather than just the name.
trading psychology -
What indicates a reversal buy signal in a Tweezers Bottom?
The second session opening where prices closed on the first session and moving straight up.
trading candlestick -
What do bears do in a downtrend before a Tweezers Bottom forms?
They push the market downward on the first session.
trading candlestick -
What is essential to confirm before trading a Tweezers Bottom?
Other elements that confirm your buying decision.
trading strategy -
What does the chart showing a Tweezers Bottom illustrate?
It illustrates the market's reversal potential after a downtrend.
trading charts -
Why is it important to understand the formation of a market?
Understanding market formation helps predict future price movements.
market prediction -
What can you easily predict if you understand why the market was formed?
You can easily predict the future movement of price.
market price prediction -
What is the anatomy of a candlestick?
A candlestick consists of: - Body - Wick (upper and lower) - Open and close prices - High and low prices
trading candlesticks -
What does a long body in a candlestick indicate?
Strong buying or selling pressure, showing the dominance of buyers or sellers.
trading candlesticks -
What does a short body in a candlestick suggest?
Indecision in the market, with buying and selling pressure being nearly equal.
trading candlesticks -
What is a doji candlestick?
A candlestick with an open and close price that are virtually equal, indicating market indecision.
trading candlesticks -
What does a bullish engulfing pattern signify?
It indicates a potential reversal from bearish to bullish, with a larger green candle engulfing a smaller red candle.
trading candlesticks -
What does a bearish engulfing pattern indicate?
A potential reversal from bullish to bearish, with a larger red candle engulfing a smaller green candle.
trading candlesticks -
What is the psychology behind a hammer candlestick?
It suggests a potential reversal after a downtrend, indicating that buyers are pushing the price up after a period of selling.
trading candlesticks -
What does a shooting star candlestick indicate?
It suggests a potential reversal after an uptrend, indicating that buyers pushed the price up but sellers took control by the close.
trading candlesticks -
What is the significance of wicks in candlesticks?
Wicks show the price extremes during the time period, indicating volatility and potential reversals.
trading candlesticks -
What is the importance of candlestick patterns in trading?
They provide insights into market psychology and potential price movements, helping traders make informed decisions.
trading candlesticks -
Identify the candlestick pattern shown in the chart image.
Refer to the chart to identify patterns numbered from 1 to 7.
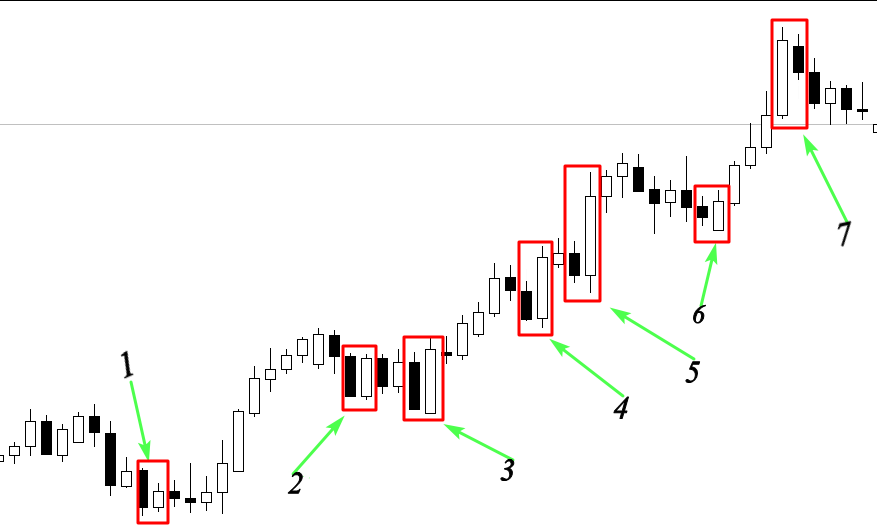 trading candlesticks
 -
What does the Bullish Harami pattern indicate?
Indecision in the market; consolidation during the session.
candlestick patterns bullish -
What does the Bullish Tweezers pattern represent?
A battle between sellers and buyers; buyers are more powerful.
candlestick patterns bullish -
What does an Engulfing bar signify?
Sellers were engulfed by buyers; indicates buyers willing to push higher.
candlestick patterns bullish -
What does the Harami pattern show?
The market enters a consolidation phase; indecision between buyers and sellers.
candlestick patterns indecision -
What is the candlestick pattern for number 1?
Bullish engulfing bar
candlestick patterns -
What is the candlestick pattern for number 2?
Hammer
candlestick patterns -
What is the candlestick pattern for number 3?
Harami pattern (Hammer + smaller body)
candlestick patterns -
What is a bullish engulfing bar?
A candlestick pattern indicating a potential reversal in price. It occurs when a small bearish candle is followed by a larger bullish candle, engulfing the previous one.
trading candlestick_patterns -
What should you focus on before learning market entry and exit techniques?
Mastering candlestick patterns.
trading learning -
What will help you identify entry and exit points in trading?
Candlestick patterns combined with technical analysis.
trading technical_analysis -
What is the goal of practicing candlestick patterns?
To understand what the candlesticks indicate about the market.
trading practice -
How can screen time and practice affect trading skills?
They improve your ability to interpret charts and candlestick patterns.
trading experience -
What transformation can occur from using price action strategies?
From a struggling beginner trader to a profitable price action trader.
trading price_action -
What should you do repeatedly to master candlestick patterns?
Open your charts and practice.
trading practice -
What is the significance of the bullish engulfing bar in trading?
It signals a potential bullish reversal in the market.
trading bullish_patterns -
What is the first step before focusing on market entries and exits?
Master candlestick patterns discussed in previous chapters.
trading foundations -
What is the benefit of mastering candlestick patterns for traders?
It enhances understanding of market movements and potential reversals.
trading candlestick_patterns -
What is the importance of market structure for traders?
It helps in using the right price action strategies in the right market conditions.
trading market_structure -
What does market structure study?
It studies market behavior.
trading market_structure -
What are the key questions to answer when analyzing market structure?
- What are the crowds doing?
- Who is in control, buyers or sellers?
- When to enter or exit the market?
- When to stay away?
trading analysis -
What are the three types of markets experienced in price action analysis?
- Trending markets
- Ranging markets
- Choppy markets
trading market_types -
What characterizes trending markets?
They have a repeating pattern of higher highs and higher lows in up-trending markets, and lower highs and lower lows in down-trending markets.
trading trending_markets -
What is a key feature of an up-trending market?
A repeating pattern of higher highs and higher lows.
trading up-trending_market -
What is a key feature of a down-trending market?
A repeating pattern of lower highs and lower lows.
trading down-trending_market -
Why is it important to study market movements?
To understand how traders behave in the market.
trading market_behavior -
What should traders do to master market structure?
They need to study how markets move and trader behavior.
trading mastery -
What are the characteristics of an uptrend?
- Higher highs (HH)
- Higher lows (HL)
trends uptrend -
What does a series of higher highs and higher lows indicate?
An uptrend in the market
trends uptrend -
How can you determine if the market is bullish or bearish?
By visual observation of price action
trends market_analysis -
What are the characteristics of a downtrend?
- Lower highs (LH)
- Lower lows (LL)
trends downtrend -
What does a series of lower highs and lower lows indicate?
A downtrend in the market
trends downtrend -
What is the EURUSD price action for the uptrend example?
1.24142, 1.24208, 1.24094, 1.24165
eurusd price_action -
What is the EURUSD price action for the downtrend example?
1.24007, 1.24740, 1.23955, 1.24182
eurusd price_action -
What visual representation can show an uptrend?
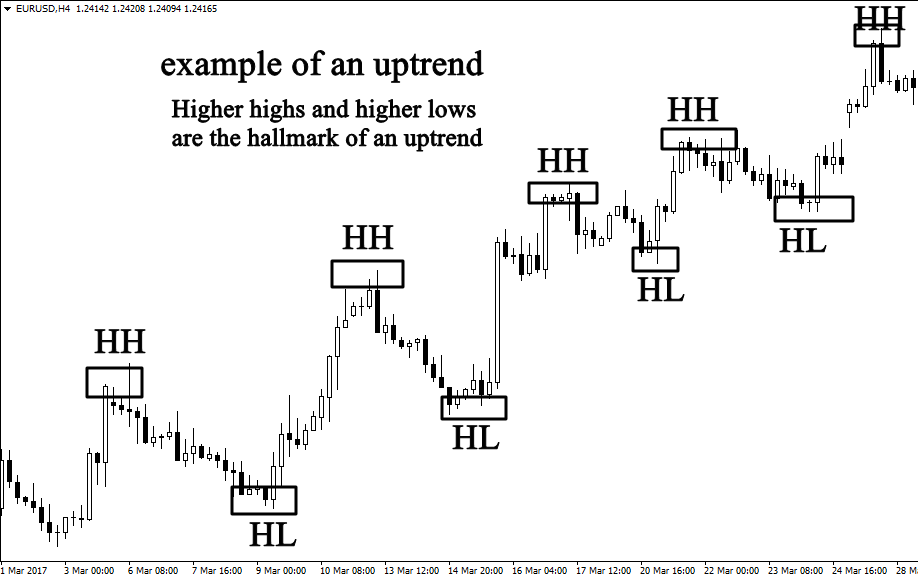 charts uptrend
 -
What visual representation can show a downtrend?
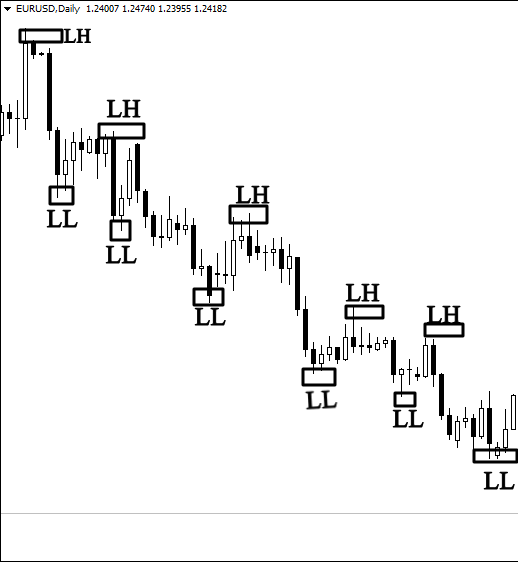 charts downtrend
 -
What indicates a bearish market?
A series of higher lows and lower lows indicating an obvious downtrend.
finance markets -
How can you identify a trending market?
By observing whether the market is making a series of higher highs and higher lows for an uptrend, or lower highs and lower lows for a downtrend.
finance markets -
What percentage of the time do trends occur according to statistics?
Trends are estimated to occur 30% of the time.
statistics finance -
What time frames should you use to determine market trends?
Use larger time frames such as the 4H, daily, or weekly time frame.
finance timeframes -
Should you use smaller time frames to determine market structure?
No, smaller time frames should not be used for this purpose.
finance timeframes -
What is a characteristic of an uptrend market?
A series of higher highs and higher lows.
finance markets -
What is a characteristic of a downtrend market?
A series of lower highs and lower lows.
finance markets -
What should you do while a trend is in motion?
Know how to take advantage of the trend.
finance trading -
What is the importance of using bigger time frames?
They provide a clearer view of the market structure.
finance timeframes -
What should you avoid when analyzing market trends?
Avoid complicating your analysis.
finance analysis -
What is the first step in trading a trending market?
Identify the trend direction: bullish or bearish.
trading markets -
In a bullish market, what should you look for?
A buying opportunity.
trading bullish -
In a bearish market, what should you look for?
A selling opportunity.
trading bearish -
What are the two important moves in trending markets?
- Impulsive move
- Retracement move
trading market_moves -
What does an impulsive move indicate?
A strong price movement in the direction of the trend.
trading impulsive_move -
What does a retracement move signify?
A temporary reversal in price before the trend resumes.
trading retracement -
In the example of EURUSD, what indicates a bullish market?
Higher highs and higher lows.
trading eurusd bullish -
What should you do when you identify a trending market?
Trade with the trend direction.
trading strategy -
What is the key characteristic of a trending market?
Consistent price movement in one direction.
trading characteristics -
What type of chart is useful for visualizing trends?
A candlestick chart.
trading charts -
What are the two moves in a trending market?
- Impulsive move
- Pullback (retracement) move
trading markets -
When do professional traders buy in a trending market?
At the beginning of an impulsive move.
trading strategies -
What do professional traders do at the end of an impulsive move?
They take profits.
trading profits -
What happens after an impulsive move in the market?
The market retraces before making another impulsive move.
trading market_behavior -
Why do traders get caught during a retracement?
They buy at the beginning of a retracement move instead of an impulsive move.
trading mistakes -
What is the best place to buy in a trending market?
At the beginning of an impulsive move.
trading buying_strategy -
What do traders often misunderstand about stop losses?
They don't understand why the market hits their stop loss before moving in the predicted direction.
trading psychology -
What is a bearish trend?
A market condition where prices are expected to decline.
trading market_trends -
What is an impulsive move in trading?
An impulsive move is a significant price movement in one direction, indicating strong momentum in the market.
trading impulsive_move -
What is a retracement in trading?
A retracement is a temporary reversal in the direction of a price trend, often seen as a pullback before the trend resumes.
trading retracement -
What should you do at the beginning of an impulsive move in a downtrend?
You should sell the market at the beginning of an impulsive move to capitalize on the downward trend.
trading strategy -
What happens if you sell during a retracement?
If you sell during a retracement, you risk being trapped by professional traders, leading to potential losses.
trading risk_management -
How can you identify downtrends and uptrends?
You can identify downtrends by observing lower lows and lower highs; uptrends are identified by higher highs and higher lows.
trading market_analysis -
Why is it important for price action traders to distinguish between impulsive moves and retracements?
Distinguishing between impulsive moves and retracements helps traders make informed decisions about when to enter or exit trades.
trading price_action -
What is the most important question for traders regarding impulsive moves?
The most important question is how to identify the beginning of an impulsive move to enter the market at the right time.
trading strategy -
What visual aid can help identify impulsive moves and retracements?
A candlestick chart illustrating impulsive moves and retracements can help traders visualize market trends.
trading charts -
What are support levels in trading?
Support levels are price points where a downtrend can be expected to pause due to buying interest. They indicate a level where demand is strong enough to prevent the price from falling further.
trading support -
What are resistance levels in trading?
Resistance levels are price points where an uptrend can be expected to pause due to selling interest. They indicate a level where supply is strong enough to prevent the price from rising further.
trading resistance -
How do you draw support levels on a chart?
Identify previous lows where price has bounced back up. Draw a horizontal line at these price points to mark support levels.
trading charting -
How do you draw resistance levels on a chart?
Identify previous highs where price has reversed downwards. Draw a horizontal line at these price points to mark resistance levels.
trading charting -
Why are support and resistance levels important?
They help traders identify potential entry and exit points, manage risk, and predict price movements in a market.
trading analysis -
What is the impulsive move in a trending market?
An impulsive move is a strong price movement in the direction of the trend, often indicating a continuation of the trend.
trading market_trends -
What should you master to predict impulsive moves?
You should master drawing support and resistance levels to effectively predict the beginning of impulsive moves in a trending market.
trading skills -
What are support and resistance levels?
Proven areas where buyers and sellers find equilibrium; major turning points in the market.
trading support resistance -
How are support and resistance levels formed?
When price reverses and changes direction; they tend to contain price movement until broken.
trading support resistance -
What happens in a trending market regarding support and resistance?
In an uptrend, previous swing points act as support; in a downtrend, they act as resistance.
trading trends support resistance -
In an uptrend, what acts as a support level?
The previous swing point acts as a support level.
trading uptrend support -
In a downtrend, what acts as a resistance level?
The old swing point acts as a resistance level.
trading downtrend resistance -
What can be seen in the example of EURUSD?
A candlestick chart showing an uptrend market with swing points and support levels.
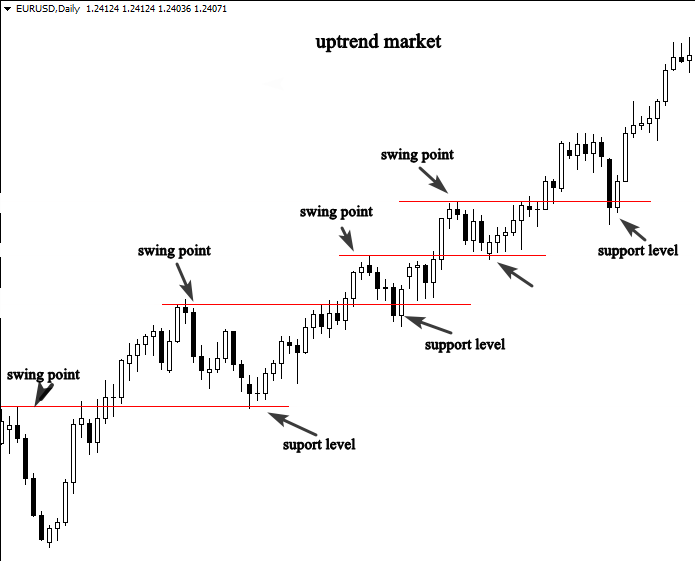 trading eurusd chart
 -
What does the previous swing point act as after a breakout?
A support level
trading support -
What happens when the market retraces to the previous swing point?
It respects the support level and begins another impulsive move.
trading retracement -
How can we predict the next impulsive move in an uptrend market?
By drawing a support level.
trading prediction -
What does the market respect when it approaches the previous swing point in a downtrend?
Resistance levels
trading resistance -
What is the significance of the previous swing point in trading?
It serves as a reference for support or resistance during market movements.
trading swing_point -
What is the chart type used to illustrate swing points and resistance levels?
A candlestick chart
charts candlestick -
In the context of GBPUSD, what are the swing point values mentioned?
1.41894, 1.42489, 1.41586, 1.42358
trading gbpusd -
What does a downtrend market indicate in trading?
The price is generally declining.
trading downtrend -
What is the role of resistance levels in a downtrend market?
They act as barriers preventing the price from rising above certain points.
trading resistance -
What visual representation is provided in the example?
A candlestick chart showing a downtrend market with swing points and resistance levels.
charts visual -
What is the effect of testing a resistance level in the market?
The price often reverses or retraces.
trading market_behavior -
What does the term 'swing point' refer to in trading?
A significant price level where the market changes direction.
trading swing_point -
What does the illustration show about the market's behavior at swing points?
It shows how the market respects support and resistance levels.
trading behavior -
What is illustrated in the provided candlestick chart?
Swing points and resistance levels in a downtrend market.
charts illustration -
What is a breakout in trading?
When the price moves beyond a defined support or resistance level.
trading breakout -
What is an impulsive move in market terms?
A strong price movement in one direction.
trading impulsive_move -
What does the market do after testing a support level?
It often goes up again.
trading market_reaction -
What can be predicted by observing previous swing points in an uptrend?
The timing of the next impulsive move.
trading prediction -
What does the term 'resistance level' signify in trading?
A price level where selling interest is strong enough to prevent the price from rising further.
trading resistance -
What is the relationship between swing points and market trends?
Swing points indicate potential reversals or continuations in trends.
trading market_trends -
What does the market do during an impulsive move?
The market makes a significant and rapid change in price direction.
trading market -
How can you predict the next impulsive move?
By understanding price action in a trending market.
trading prediction -
What is one method to catch the beginning of an impulsive move?
Drawing trend lines.
trading trendlines -
What is a trend line?
A linear level that the price respects during market movements.
trading trendlines -
What do bullish markets create in terms of trend lines?
Linear support levels.
trading bullish -
What do bearish markets form in terms of trend lines?
Linear resistance levels.
trading bearish -
What is the significance of swing highs and lows in the market?
They indicate the market's tendency to respect trend lines.
trading market -
What skill is essential for identifying key support and resistance levels?
Learning to draw and interpret trend lines.
trading technical_analysis -
What does it mean for price to respect a trend line?
Price tends to bounce off or react at the trend line level.
trading price_action -
What is the role of trend lines in a trending market?
They help identify potential support and resistance levels.
trading trendlines -
What is the minimum number of swing points needed to draw a trend line?
At least 2 swing points
trading trendlines -
What time frames should you use to draw trend lines?
Always use 4H and daily time frames
trading timeframes -
What is the purpose of drawing trend lines in trending markets?
To identify the beginning of impulsive moves
trading trendlines -
Should trend lines be forced?
No, the levels must be clear
trading trendlines -
In a downtrend, what does the market do when it approaches the trend line?
The market reverses and continues in the same direction
trading downtrend -
What is an example of a currency pair in a downtrend?
USDCHF
trading currency -
What are the specific price levels mentioned for USDCHF in a downtrend?
0.93061, 0.93409, 0.93030, 0.93106
trading prices -
What should you focus on when drawing trend lines?
Focus on obvious trend lines in trending markets
trading trendlines -
What will be explained in the next chapter?
How to trade trend lines in combination with price action setups
trading priceaction -
What do trend lines help us anticipate in the market?
The next impulsive move with the direction of the market.
trading analysis -
What is an example of a market trend discussed?
An uptrend market.
trading uptrend -
What do trend lines allow us to predict?
The next movement upward.
trading prediction -
What should you look for when analyzing trending markets?
Previous swing points (support and resistance).
trading analysis -
What exercise is suggested for understanding trending markets?
Open your charts and find trending markets.
trading exercise -
What is the importance of drawing trend lines correctly?
It helps predict high probability entries in the market.
trading strategy -
What do you need to find to understand how trending markets move?
Trend lines and previous swing points.
trading understanding -
What does the market respect according to the text?
The trend line.
trading market_behavior -
What is a ranging market?
A market that moves horizontally, with price bouncing between support and resistance levels.
trading markets -
What are the characteristics of a ranging market?
- Moves horizontally
- Price oscillates between support and resistance
- No clear trend direction
trading markets -
What happens when a market stops making higher highs and higher lows?
It is considered to be ranging.
trading markets -
What is the difference between trending and ranging markets?
Trending markets form patterns of higher highs/lows or lower highs/lows; ranging markets do not.
trading markets -
What is the support level in a ranging market?
The price level where buying interest is strong enough to prevent the price from falling further.
trading markets -
What is the resistance level in a ranging market?
The price level where selling interest is strong enough to prevent the price from rising further.
trading markets -
What does a chart of a ranging market look like?
It shows price bouncing between horizontal support and resistance levels.
trading charts -
What do ranging markets tend to do?
Move horizontally between key support and resistance levels.
trading markets -
What is crucial for using price action strategies effectively?
Understanding the difference between ranging and trending markets.
trading strategies -
What happens in a ranging market?
Buyers are equal to sellers, creating equilibrium.
trading market_behavior -
What occurs when range structures break out?
A trending condition starts to organize.
trading market_behavior -
Where do the best buying and selling opportunities occur in ranging markets?
At key support and resistance levels.
trading opportunities -
What are the three ways to trade ranging markets?
- Wait for price to approach support or resistance.
- Buy at key support level.
- Sell at key resistance level.
trading strategies -
What skill is important when analyzing charts?
Deciding whether the market is trending or ranging.
trading analysis -
What will be covered in the next chapters?
Trading tactics and strategies for trending or ranging markets.
trading strategies -
What is a key characteristic of trading in ranging markets?
It is completely different from trading in trending markets.
trading market_types -
Where are the best buying opportunities in a ranging market?
At the support level.
trading buying -
Where are the best selling opportunities in a ranging market?
At the resistance level.
trading selling -
What is a breakout in trading?
When the price moves beyond the support or resistance level, indicating a new trend.
trading breakout -
What does a breakout indicate about a ranging market?
It signals that the ranging period is over and a new trend is beginning.
trading trends -
What should you pay attention to in a ranging market?
The boundaries of support and resistance levels.
trading boundaries -
What happens when a player takes control of the market?
A breakout occurs, leading to a potential new trend.
trading control -
What is the significance of support and resistance levels?
They define the points where buying and selling opportunities arise in a ranging market.
trading support resistance -
What is the visual representation of a ranging market?
A candlestick chart showing horizontal price movement with buy and sell points.
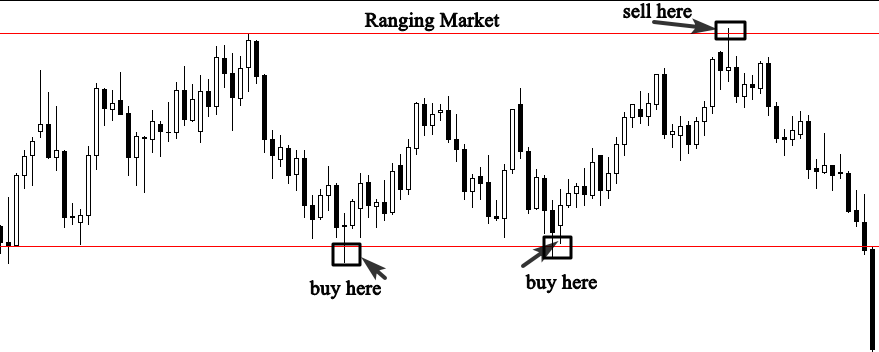 trading charts
 -
What is the current EURUSD price?
1.24124
forex eurusd -
What are the high and low prices for EURUSD?
High: 1.24975 Low: 1.23846
forex eurusd -
What indicates a beginning of a trend in trading?
A breakout above the resistance level.
trading trends -
What can be deceptive in trading breakouts?
Range boundaries are often overshot, giving the illusion of a breakout.
trading deception -
What is a pullback in trading?
A pullback is a chance to join the trend after the breakout of support or resistance.
trading pullback -
What should traders do after a breakout?
They should wait for a pullback to enter the trend.
trading breakout -
What is a resistance level?
A price level where upward movement is halted.
trading resistance -
What is a support level?
A price level where downward movement is halted.
trading support -
What happens when the price breaks out of a resistance level?
It indicates a potential beginning of a trend.
trading breakout -
What should traders be cautious of during a breakout?
Traders can get trapped if they position into a false breakout.
trading risk -
What is the best way to enter the market after a breakout?
After the breakout occurs.
trading entry -
What is shown in the example provided?
A candlestick chart showing a breakout above a resistance level.
trading chart -
What does the term breakout refer to in trading?
A breakout occurs when the price moves beyond a defined support or resistance level, indicating the end of a ranging period and the start of a new trend.
trading breakout -
What happens to resistance after a breakout?
After a breakout, the previous resistance level often becomes a new support level during a pullback.
trading support resistance -
When does a ranging market occur?
A ranging market occurs when the price moves horizontally between defined support and resistance levels.
trading market ranging -
What should you focus on in a ranging market?
Focus on key levels of support and resistance, as breakouts from these levels indicate the end of the ranging period.
trading support resistance -
What does a breakout indicate?
A breakout indicates that the ranging period is over and a new trend may be beginning.
trading breakout -
What is the significance of a pullback after a breakout?
A pullback after a breakout represents a good opportunity to join buyers with a favorable risk-to-reward ratio.
trading pullback opportunity -
What is the risk associated with a breakout?
Ensure the breakout is genuine to safely join the new trend, as false breakouts can lead to losses.
trading risk breakout -
What is the price range mentioned for GBPUSD?
1.42294 to 1.42604, with 1.42271 as the low and 1.42538 as the high.
trading gbpusd prices -
What is the date range mentioned in the chart for GBPUSD?
From 21 May 2013 to 13 June 2013.
trading dates gbpusd -
What does the chart illustrate?
The chart illustrates a breakout, resistance, support, and pullback in the GBPUSD trading pair.
trading chart gbpusd -
What should you do if you miss the breakout?
Wait for the pullback and enter the market.
trading strategy -
How can you identify if a market is worth trading?
Ensure you can identify the boundaries (support and resistance).
trading analysis -
What indicates a choppy market in Forex?
A market with no clear directions and a lot of noise.
forex market_analysis -
What feelings might arise in a choppy market?
You may feel emotional and doubt your trading strategies.
trading psychology -
How can you determine if a market is choppy?
Zoom out on the daily chart to see the bigger picture.
trading chart_analysis -
What is a common characteristic of choppy markets?
They can make it hard to decide if the market is ranging or trending.
forex market_behavior -
What is an example of a choppy chart?
CHFJPY, H4: 118.463, 118.542, 118.206, 118.235.
forex charting -
What can help you identify a choppy market more easily?
Experience, screen time, and training help in identifying market conditions.
trading experience -
What does a lot of noise in a chart indicate?
It indicates a choppy market that is not worth trading.
trading market_analysis -
What should you do when you feel you can't identify market boundaries?
Recognize it as a choppy market and reconsider trading.
trading strategy -
What is the best practice after missing a breakout?
Wait for a pullback to enter the market confidently.
trading strategy -
What can cause a drop in performance in trading?
Trading in a choppy market can lead to performance drops.
trading performance -
What is the importance of identifying market conditions?
It helps in making informed trading decisions and avoiding losses.
trading analysis -
What can excessive noise in a chart lead to?
Doubt in your trading strategies and emotional responses.
trading psychology -
What should you look for in a market to avoid choppy conditions?
Look for clear support and resistance levels.
trading analysis -
What is a visual cue of a choppy market?
A candlestick chart with irregular patterns and no clear trend.
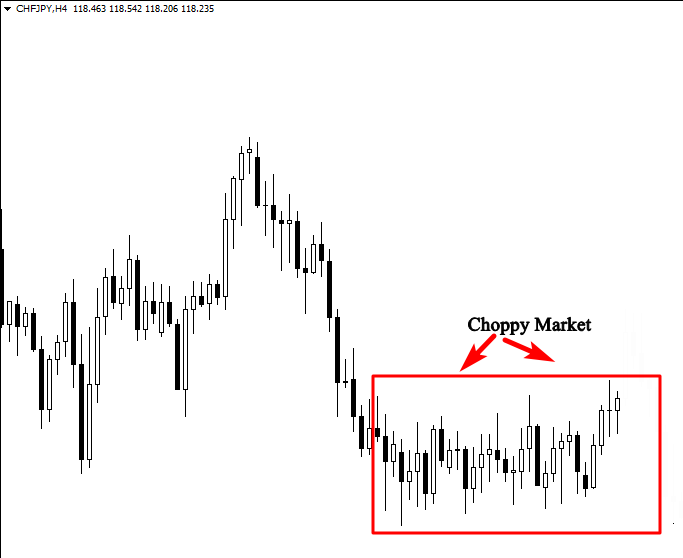 trading charting
 -
What does choppy price action indicate in a market?
It indicates that the market is moving sideways in a very small tight range.
trading market_analysis -
Should you trade in a choppy market?
No, it is not worth trading in a choppy market.
trading market_conditions -
What happens if you trade in a choppy market?
You may give back your profits shortly after big winners.
trading risk_management -
What often occurs after a market makes big moves?
Markets often consolidate after making big moves.
trading market_behavior -
What does a tight range in price action suggest?
It suggests a choppy market that traders should avoid.
trading market_analysis -
What is the primary time frame for price action trading?
- 1H
- 4H
- Daily
trading timeframes -
Why should you avoid trading on the 5-minute time frame?
There is a lot of noise and false signals due to market volatility.
trading timeframes -
What is the concept of top down analysis in trading?
Start with larger time frames to get the big picture, then switch to smaller ones for trading decisions.
trading analysis -
What should you analyze before trading the 4H chart?
- Weekly chart
- Daily chart
trading 4h -
What should you analyze before trading the 1H chart?
- Daily chart
trading 1h -
What information do you gather during top down analysis?
- Important support and resistance levels
- Market turning points
trading analysis -
What do support and resistance levels indicate in trading?
They represent turning points in the market.
trading support resistance -
What happens when price approaches support and resistance levels?
You can decide to buy, sell, or ignore market signals.
trading support resistance -
What is a critical step for price action traders?
Analyzing higher time frames before making trading decisions.
trading strategy -
What is the risk of focusing on a single time frame in trading?
It may lead to low probability trading setups.
trading strategy -
What does the weekly analysis help identify?
- Market trend (up or down)
- Market condition (ranging or choppy)
- Actions of big investors
trading analysis -
Why is the previous candle on the weekly chart important?
It provides information about the week's market activity and future market moves.
trading candlestick -
What can be analyzed on the daily chart or 4h chart?
- Market condition (trending, ranging, choppy)
- Key levels (support, resistance, supply, demand)
- Price action signals (candlestick patterns)
trading charting -
What are key levels to identify on the 4h or daily time frame?
- Support and resistance
- Supply and demand areas
- Trend lines
trading levels -
What is a price action signal?
A candlestick pattern indicating a buy or sell signal, such as: - Pin bar - Engulfing bar - Inside bar
trading price_action -
What is the top-down analysis concept in trading?
It involves analyzing larger time frames before switching to smaller ones for better trading decisions.
trading top-down_analysis -
What can happen if you don't analyze the bigger time frame before trading?
You may miss important market trends and signals, leading to poor trading decisions.
trading risk_management -
What does the weekly chart indicate about the market?
It shows important resistance levels and potential rejection points for market decisions.
market_analysis charts -
What is the highest resistance level mentioned?
102.490
resistance levels -
What is the lowest resistance level mentioned?
76.520
resistance levels -
What indicates a rejection from resistance in the market?
The price was rejected immediately upon approaching the resistance level, indicating sellers are active.
market_behavior rejection -
What pattern confirms a potential reversal in the market?
The formation of inside bar false breakout patterns.
chart_patterns reversal -
What is a risk when trading near resistance levels?
It is risky to 'buy through' the resistance level without confirmation.
trading risk_management -
What was the date range of the analysis provided?
From 2 Aug 2015 to 30 Jul 2017.
time_frame analysis -
What does a false breakout indicate?
It suggests a potential reversal in market direction.
breakout market_analysis -
What should traders look for on the daily time frame?
They should analyze current market conditions and potential price movements after identifying resistance levels.
daily_analysis trading -
What is the significance of the price levels listed?
They represent key resistance levels that traders should monitor for potential market reactions.
price_levels trading -
What is the major weekly level mentioned in the data?
- 90.640
- 90.160
- 89.690
- 89.210
- 88.727
trading levels -
What indicates a bullish signal on the daily chart?
A clear pin bar candlestick pattern indicates a bullish signal.
trading candlestick -
What should you do if you analyze the weekly chart?
Consider selling the market if there is a clear signal, rather than buying.
trading analysis -
What is the buy signal level listed in the data?
87.310
trading signals -
What is the lowest level listed in the data?
-86.840
trading levels -
What is the highest level listed in the data?
90.640
trading levels -
What does a clear pin bar signal suggest for trading?
It suggests buying the market if focusing on one time frame.
trading candlestick -
What is the key level that might stop the market from going up?
A very powerful key level on the weekly chart.
trading levels -
What is the date range for the major weekly levels?
From 3 Mar 2017 to 17 Jul 2017.
trading dates -
What does the bullish trend indicate in trading?
It indicates that the market is expected to rise.
trading trends -
What is the importance of top down analysis in trading?
It shows that elements from higher time frames can dominate over signals on your trading time frame, improving decision-making.
trading analysis -
What happened to the bullish candlestick signal after the market reached the weekly turning point?
The bullish candlestick signal did not survive long after the market moved into the weekly turning point.
trading candlestick -
Why is trading based on one-time frame not recommended?
It can lead to losing your entire trading account and hinder success as a trader.
trading advice -
What can happen when trading counter trends without top down analysis?
You may put yourself in trouble and face significant losses.
trading countertrends -
What is a pin bar candlestick signal?
A candlestick pattern that indicates a potential reversal in price direction, often used in trading.
trading candlestick -
What does the weekly resistance level represent in trading?
It is a powerful turning point that can reverse market direction, impacting trading signals.
trading resistance -
What is the risk of ignoring top down analysis?
Ignoring it can lead to poor trading decisions and increased risk of losses.
trading risk -
What is the significance of the weekly level in trading?
It can dominate and influence the effectiveness of trading signals from lower time frames.
trading weekly -
What is the date range mentioned in the trading example?
27 Jun 2017 to 4 Aug 2017.
trading dates -
What type of chart is referenced in the example?
A candlestick chart showing a daily time frame with a candlestick buy signal.
trading chart -
What is a proven weekly turning point in trading?
A price level where a reversal is highly anticipated based on historical data.
trading analysis -
What does it mean when price is at major resistance?
It indicates a level where buyers have been rejected and a reversal is likely.
trading resistance -
How can traders identify a potential selling opportunity?
By switching to a daily time frame and looking for setups near weekly resistance.
trading strategy -
What indicates that the market is at a hot point?
Rejections of buyers at a major resistance level, suggesting a potential reversal.
trading market_analysis -
What is the significance of the chart provided?
It shows a weekly resistance level where price has been rejected twice.
trading chart -
What should be the next step after identifying resistance?
Look for sell signals on the trading time frame.
trading signals -
What does the weekly chart indicate about price movements?
It shows historical price levels that act as turning points for potential reversals.
trading weekly_chart -
What is the date range shown in the example chart?
From 28 Aug 2016 to 27 Aug 2017.
trading time_frame -
What does a rejection at resistance imply?
A strong likelihood of a price reversal at that level.
trading rejection -
What is the first step to take when price is at resistance?
Switch to a lower time frame to analyze potential selling opportunities.
trading strategy -
What does a high probability setup mean?
A trading opportunity that has a strong chance of success based on analysis.
trading probability -
What can traders conclude from historical price levels?
They often serve as significant turning points for future price movements.
trading historical_data -
What is the importance of looking to the left on the chart?
It helps identify past major reversal points in the market.
trading chart_analysis -
What does the image in the example depict?
A weekly candlestick chart showing a proven weekly turning point and price at major resistance.
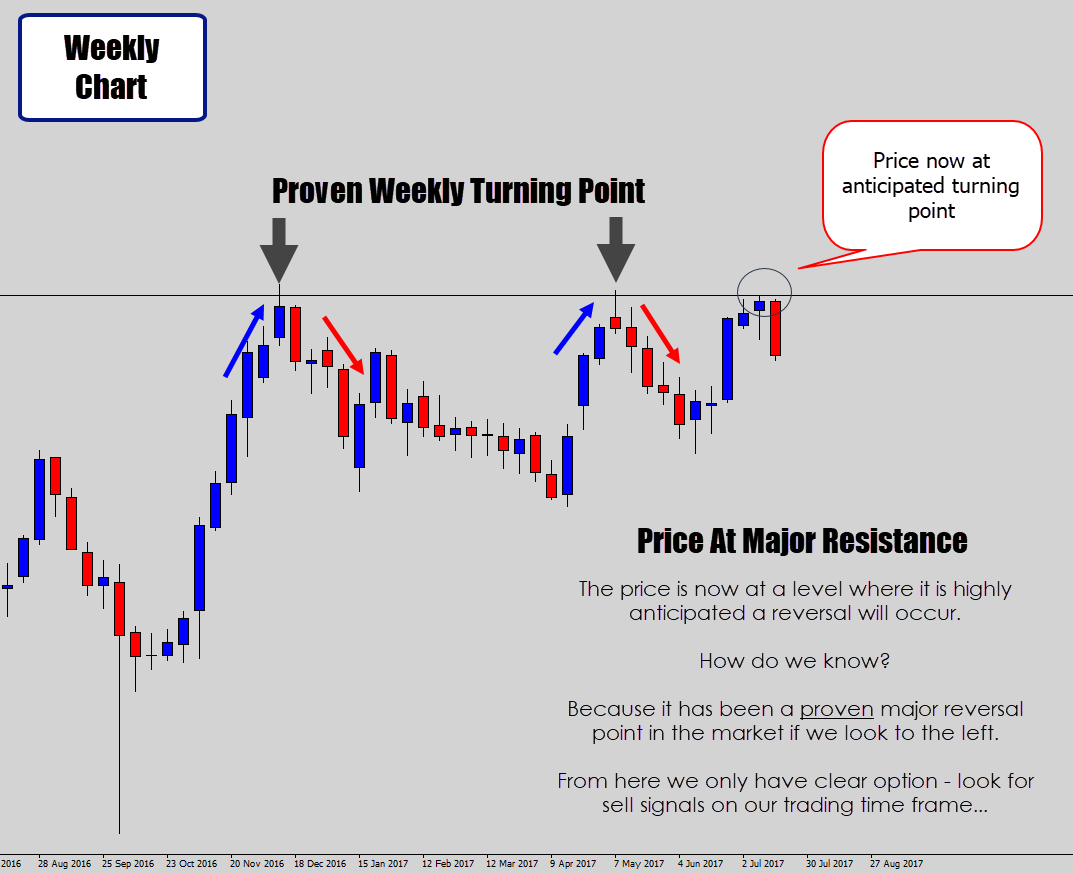 trading chart
 -
What is the major reversal level indicated in the chart?
148.030
charts analysis -
What is the bearish reversal level indicated in the chart?
147.290
charts analysis -
What candlestick signal is observed near the resistance level?
Pin bar
candlestick signals -
What pattern indicates a potential trend change?
Inside bar false breakout
patterns trends -
What is the lowest level recorded in the daily chart?
138.450
charts analysis -
What does the daily chart confirm about the weekly analysis?
It confirms a clear bearish signal near resistance.
charts analysis -
What is the significance of the pin bar in the analysis?
It indicates rejection from the resistance level.
candlestick signals -
What does a false breakout suggest in trading?
It indicates a potential trend change.
trading analysis -
When was the highest level reached in the daily chart?
148.030
charts analysis -
What does a bearish signal near a resistance level imply?
Potential downward price movement.
charts analysis -
What is the date range of the data presented in the chart?
June 8, 2017 to July 12, 2017
dates charts -
What does the term weekly resistance level refer to?
A price level where upward movement is expected to stall.
analysis trading -
What trend change is indicated by the daily chart analysis?
A shift from bullish to bearish sentiment.
trends analysis -
What is a major reversal level?
A point on a chart where the price trend reverses significantly, indicating a potential change in direction.
trading analysis -
What does the term Huge Reversal indicate?
A significant shift in price direction at a specific level, often marked by high volatility.
trading reversal -
What is the importance of mastering counter trend trading?
It allows traders to capitalize on price reversals, but requires experience and skill.
trading strategy -
What is recommended for beginners in trading?
Stick with the trend and practice top down analysis before attempting counter trend setups.
trading beginners -
What is the top down analysis approach in trading?
A method that starts with broader market trends and narrows down to specific trades.
trading analysis -
How can keeping analysis simple benefit traders?
It reduces confusion and builds confidence in trading decisions.
trading strategy -
What should traders do to improve their skills?
Open charts and practice the concepts learned in trading education.
trading practice -
What is the date of the highest major reversal level listed?
June 5, 2017, with a level of 148.030.
trading data -
What is the lowest major reversal level recorded?
138.450, reached on July 25, 2017.
trading data -
How can traders time market turns?
By using various approaches, though many can lead to confusion.
trading timing -
What should traders focus on to trade the right way?
Mastering top down analysis and practicing regularly.
trading strategy -
What does a candlestick chart show?
It visually represents price movement over time, indicating reversals and trends.
trading charts -
What is the first step in identifying market trends?
Practice and screen time are essential.
market trends techniques -
How can market trends be identified?
By using specific techniques and gaining experience.
market trends techniques -
What might be confusing at the beginning of market trend analysis?
Identifying the market direction.
market confusion trends -
What is essential for becoming proficient in identifying market trends?
Screen time and practice.
market trends practice -
What should you expect when first learning to identify market trends?
It will be a little confusing.
market learning trends -
What will help you find it easy to identify market direction?
Consistent practice and screen time.
market direction practice -
What are the three important aspects of price action trading?
- Market Trends
- Levels
- Signals
trading price_action -
How do you identify the market trend?
Using multiple time frames analysis to differentiate between trending and range bound markets.
trading market_trends -
What should you do if the market is choppy?
Close your chart and stay away from trading.
trading market_analysis -
What are the two boundaries in a ranging market?
The market trades horizontally between two boundaries.
trading market_analysis -
What are support and resistance levels used for?
To better enter the market at the right time.
trading levels -
What is the first question to answer when analyzing a chart?
What the market is doing: trending, consolidating, or choppy?
trading chart_analysis -
What is an uptrend?
A market condition where prices are consistently moving upwards.
trading market_trends -
What is a downtrend?
A market condition where prices are consistently moving downwards.
trading market_trends -
What do you look for in a trending market?
Identify if it is an uptrend or downtrend.
trading market_trends -
What is the purpose of drawing trend lines?
To identify support and resistance levels in the market.
trading levels -
What is the key to making money in trading?
Using the three aspects: trend, level, and signal.
trading strategy -
How can you differentiate between trending markets and range bound markets?
By analyzing the market movements and patterns over multiple time frames.
trading market_trends -
What does a consolidating market indicate?
The market is moving sideways and not showing a clear trend.
trading market_trends -
What is the role of psychology in candlestick patterns?
It helps understand the formation and message of the patterns.
trading signals -
What is a powerful level in trading?
A significant support or resistance level that influences market movement.
trading levels -
What should you do if the market is trending up?
Look for support levels to enter the market.
trading levels -
What should you do if the market is trending down?
Look for resistance levels to enter the market.
trading levels -
What are the best zones for buying and selling in the market?
These levels are the best zones where you can buy and sell the market.
trading market -
What does the best signal to enter the market indicate?
The best signal to enter the market means the right time to execute your trade.
trading signals -
What will you learn in the next chapter?
You will learn about the best signal to enter the market.
trading learning -
What is the pin bar candlestick pattern used for?
To determine reversal points in the market.
trading candlestick -
What characterizes a pin bar?
A very long tail and a small real body.
trading candlestick -
What does the long tail of a pin bar indicate?
Rejection and potential movement in the opposite direction.
trading candlestick -
What is the area between the open and close of a pin bar called?
The real body.
trading candlestick -
What is a Bullish pin bar characterized by?
Long lower wicks.
trading candlestick -
What is a Bearish pin bar characterized by?
Long upper wicks.
trading candlestick -
Which color of a bullish candle is considered more powerful?
A white real body.
trading candlestick -
Which color of a bearish pin bar is more significant?
A black real body.
trading candlestick -
What is the visual appearance of a Bullish Pin Bar?
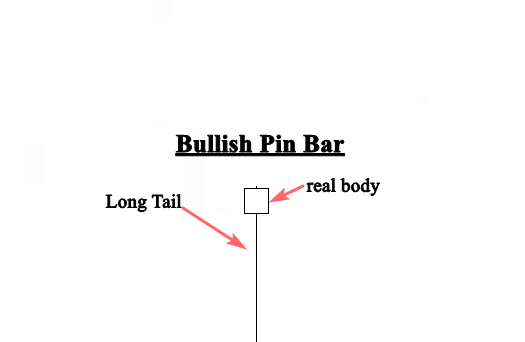 trading candlestick
 -
What is a bearish pin bar?
A candlestick pattern characterized by a small real body and a long upper tail, indicating potential reversal in an uptrend.
trading candlestick -
What does the real body of a candlestick represent?
The difference between the opening and closing prices of a security during a specific time period.
trading candlestick -
What is a long tail in a pin bar candlestick?
The extended part of the candlestick that indicates rejection of higher prices, showing selling pressure.
trading candlestick -
How to identify pin bar candlestick setups?
Look for a small real body with a long tail, preferably near key support or resistance levels.
trading candlestick -
What is the significance of a pin bar near a support level?
It indicates a potential buying opportunity, especially in an uptrend market.
trading support -
Why are quality price action setups rare in the market?
Because market movements are driven by supply and demand, not just pin bar formations.
trading market -
What happens if buyers' investment is less than sellers' in a pin bar setup?
The bullish signal may fail, leading to a potential loss despite the pin bar formation.
trading risk -
What is the law of supply and demand in trading?
It dictates that price movements are determined by the balance between buyers and sellers.
trading economics -
What should you do when you identify a quality pin bar candle?
Consider it a strong buying signal, especially if it aligns with market trends and support levels.
trading strategy -
What does a bearish pin bar indicate in an uptrend?
It suggests potential reversal or selling pressure, signaling traders to be cautious.
trading candlestick -
What is the visual representation of a bearish pin bar?
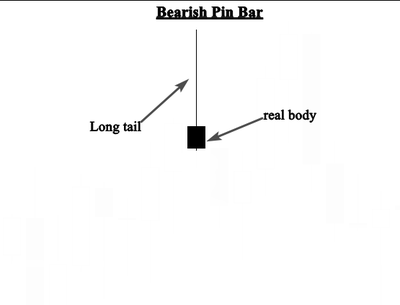 trading candlestick
 -
What happens if the market does not go in your predicted direction?
You accept your loss and look for another opportunity.
trading risk -
Why is it important to look for quality pin bar setups?
To increase the probabilities of success in trading.
trading pinbars -
What is a key mindset of successful traders?
To evaluate setups from multiple angles and focus on quality.
trading mindset -
Which time frames should be considered for pin bar setups?
Bigger time frames such as the 4 hour or daily time frame.
trading timeframes -
Why should smaller time frames be ignored for pin bar setups?
They generate a lot of false signals.
trading false_signals -
What does it mean if a pin bar setup fails?
It does not necessarily mean your analysis is wrong.
trading analysis -
What is trading fundamentally about?
It is a game of probabilities with no certainty.
trading probabilities -
What should you do when a signal fails?
Accept the loss and look for another opportunity.
trading losses -
What is the importance of evaluating pin bar setups?
To put the probabilities of success in your favor.
trading evaluation -
What is a pin bar in trading?
A price action signal indicating potential reversals.
trading pinbars -
When is a pin bar more powerful?
A pin bar is more powerful when it forms in line with the direction of the market trend, rather than against it.
trading candlestick -
What does a clear trend indicate in the market?
A clear trend indicates who is in control of the market, either buyers or sellers.
trading market_analysis -
Why is a pin bar formation with the trend effective?
The formation of a pin bar with the trend is effective because it aligns with the prevailing market direction, increasing the likelihood of a successful trade.
trading candlestick -
What is the significance of the chart shown?
The chart displays pin bars formed against and with the trend in an uptrend market, illustrating their effectiveness.
trading charts -
What should you do with bullish pin bars formed in line with the uptrend?
They should be taken into consideration.
trading candlestick -
What should you do with bearish pin bars formed against the trend?
They should be ignored.
trading candlestick -
What is important to check in the anatomy of a pin bar?
The distance between the real body and the tail.
trading candlestick -
What characteristic of pin bars makes them more powerful?
Pin bars with longer tails are more powerful.
trading candlestick -
What do pin bars indicate about price action?
They indicate price rejection but not necessarily a reversal.
trading candlestick -
Where should you watch for pin bar formations?
Major key levels like support and resistance, supply and demand zones, and moving averages.
trading candlestick -
What does a rejection near a support level indicate?
It indicates that bulls are more powerful and willing to push the market upward.
trading candlestick -
What does the formation of a pin bar near key levels signify?
It gives a clear idea about market behavior.
trading candlestick -
What does a pin bar signal indicate near a resistance level?
It indicates that bears reject prices and prevent bulls from breaking this level, suggesting sellers are pushing the market downward.
trading candlestick -
What happens when a pin bar forms at a support level?
It indicates that buyers are rejecting lower prices, suggesting a potential upward movement in the market.
trading candlestick -
What do bears do when a pin bar forms near a resistance level?
Bears reject prices and prevent bulls from breaking this level.
trading candlestick -
What do sellers indicate when a pin bar forms at a resistance level?
Sellers are willing to push the market downward.
trading candlestick -
What is the significance of a pin bar in trading?
It signals potential reversals in price direction, indicating market sentiment.
trading candlestick -
What visual representation is used to analyze a pin bar signal?
A candlestick chart is used to analyze a pin bar signal.
trading charts -
What is a pin bar signal?
A price action pattern indicating potential reversals in the market, characterized by a long wick and a small body.
trading pinbar -
What does understanding pin bar psychology help with?
It helps predict future price movements and make high probability trades.
trading psychology -
What is the significance of resistance levels?
Resistance levels indicate price points where selling pressure may increase, preventing further price rises.
trading resistance -
What is the price action in relation to pin bars?
Price action refers to the movement of prices over time, which pin bars help analyze for trading opportunities.
trading priceaction -
What are the components of a pin bar?
- Long wick (tail)
- Small body
- Close near the open
trading pinbar -
How can a trader use a pin bar signal?
By identifying potential reversals and making trades based on high probability setups.
trading strategy -
What does a long wick on a pin bar indicate?
It indicates rejection of higher prices and potential reversal in market direction.
trading pinbar -
What is the importance of psychology in trading pin bars?
Understanding trader psychology can enhance decision-making and improve trading outcomes.
trading psychology -
What is the first step to trade based on pin bar signals?
Identify the pin bar formation at significant support or resistance levels.
trading pinbar -
What should traders consider when analyzing a pin bar?
Traders should consider the context of the market, previous price action, and volume.
trading analysis -
Why should beginners trade with the trend?
Trading with the trend offers better opportunities and a higher risk/reward ratio, especially when using pin bars.
trading beginners -
What should you identify before trading a pin bar?
Identify a clear uptrend or downtrend before waiting for a pin bar to occur after a pullback.
trading strategy -
What does a pin bar signal when it occurs at a support or resistance level?
It signals a potential price reversal at that level, providing a trading opportunity.
trading signals -
What is the risk/reward ratio when trading pin bars with the trend?
The risk/reward ratio is generally favorable in trending markets, making it a desirable strategy.
trading risk_management -
What is the first step in the pin bar trading strategy?
The first step is to identify a clear uptrend or downtrend.
trading strategy -
What occurs after identifying a trend in pin bar trading?
Wait for a pin bar to occur after a pullback to a support or resistance level.
trading strategy -
What does the example of GOLD show in the context of pin bar trading?
It illustrates how a pin bar at a resistance level can indicate a potential price rejection.
trading example -
What should you do after mastering trading with the trend?
You can move on to trade range-bound markets or counter-trends.
trading advanced -
What does the retracement move indicate in pin bar trading?
It indicates a temporary price pullback before a potential continuation of the trend.
trading price_action -
What is the significance of a pin bar at a resistance level?
It suggests that the price may reverse downwards after hitting that resistance.
trading pin_bar -
What is depicted in the candlestick chart example provided?
A pin bar at a resistance level, with a retracement move indicated.
trading chart visual -
What is the next step after identifying a pin bar signal?
Execute a trade based on your analysis of the pin bar and the trend direction.
trading execution -
What does a successful pin bar trade require?
It requires proper analysis, risk management, and adherence to the trend.
trading success -
What is the goal of trading pin bars?
To capitalize on potential price reversals and maximize profits.
trading profit -
What is the importance of waiting for a pullback in pin bar trading?
It provides a better entry point and improves the risk/reward ratio.
trading strategy -
What is the key focus when trading pin bars?
Focus on trading with the trend for better success rates.
trading focus -
What does the formation of a pin bar indicate?
The end of the retracement move and the beginning of the impulsive move at the resistance level in line with the downtrend.
trading pin_bar -
What are the criteria for a high-quality setup?
- Well-formed pin bar in line with market direction
- Rejection at a major key level (resistance level)
- Good risk to reward ratio
trading setup -
What role does the 21-moving average play in trading?
Acts as dynamic support in an uptrend and dynamic resistance in a downtrend.
trading moving_average -
What does a resistance level indicate in a downtrend?
That the bears are still in charge of the downtrend.
trading resistance_level -
What is a major key level in trading?
A significant point in the market where price rejection occurs, often a resistance level.
trading key_level -
When is it difficult to draw support and resistance levels?
When prices move in a way that does not allow spotting static key levels.
trading support resistance -
What currency pair is represented in the first chart?
USD/CHF
forex charts -
What is the value of USDCHF at the time of the analysis?
0.97448
forex usdchf -
What moving average is mentioned as acting as a resistance level?
21 moving average
forex moving_averages -
What trading signal is indicated in the USDCHF chart?
Pin bar signal
forex trading_signals -
What trend is the USDCHF market currently in?
Downtrend
forex trends -
What does the 21 moving average help identify in trading?
Dynamic resistance levels
forex moving_averages -
What is the value of EURUSD at the time of the analysis?
1.18136
forex eurusd -
What is the trend of the EURUSD market indicated in the chart?
Uptrend
forex trends -
What trading signal is indicated in the EURUSD chart?
Pin bar signal
forex trading_signals -
What does the 21 moving average indicate in the EURUSD chart?
It supports the uptrend
forex moving_averages -
What is the significance of a pin bar signal in trading?
High probability setup for reversals
forex trading_signals -
What is the importance of moving averages in trading?
Identifying dynamic resistance/support levels
forex moving_averages -
What does a pin bar signal in a downtrend suggest?
Potential reversal or continuation
forex trading_signals -
What time frame is used for the analysis of USDCHF and EURUSD?
H4 (4-hour)
forex time_frames -
What is the highest value of USDCHF in the analysis?
0.97498
forex usdchf -
What is the lowest value of USDCHF in the analysis?
0.97420
forex usdchf -
What is the highest value of EURUSD in the analysis?
1.18154
forex eurusd -
What is the lowest value of EURUSD in the analysis?
1.17804
forex eurusd -
What date is indicated in the EURUSD analysis?
September 2010
forex dates -
What is the chart showing in the first image?
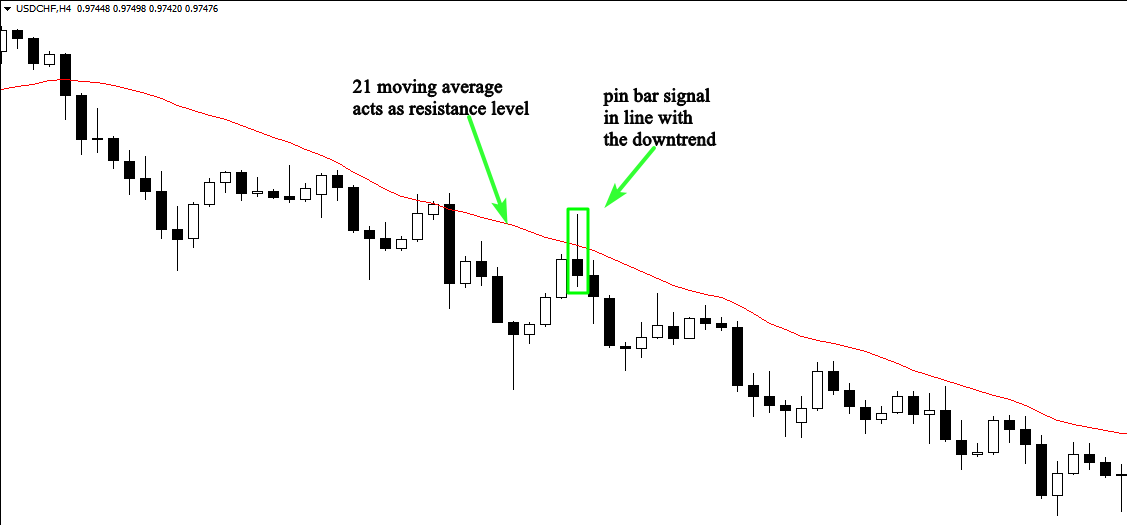 forex charts
 -
What is the chart showing in the second image?
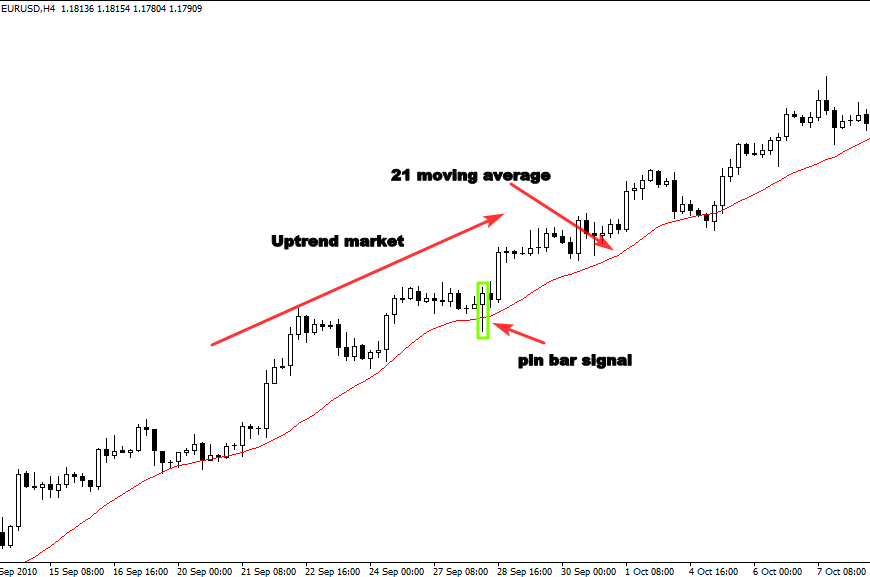 forex charts
 -
What does the 21-moving average help identify in the market?
Key points in the market.
trading technical_analysis -
What happens when prices approach the moving average?
Buying pressure occurs, leading to a price increase.
trading market_behavior -
What signal is clear when the trend is bullish?
The pin bar signal.
trading signals -
What does a rejection from the 21-moving average indicate?
A confirmation signal to buy the market.
trading buy_signals -
What anatomy does the price action setup have when bullish?
Bullish anatomy.
trading price_action -
What does the pin bar signal indicate in a bullish trend?
It confirms the bullish trend.
trading signals -
What is the effect of buying pressure on prices?
Prices go up.
trading market_dynamics -
In a bullish trend, what does the 21-moving average act as?
A support level.
trading technical_analysis -
What is the first step in trading tactics?
Identify the trend (uptrend or downtrend) and the level (support or resistance).
trading tactics -
What should you look for near support or resistance levels?
A pin bar in line with the direction of the trend.
trading candlestick -
What is the aggressive entry option in trading pin bars?
Enter the market immediately after the pin bar closes without waiting for confirmation.
trading entry_options -
Why use the aggressive entry option?
To catch the move from the beginning before the price goes higher.
trading strategy -
What is shown in the example with AUDCAD?
A downtrend market with support becoming resistance and a stop loss.
trading example -
What happens if you don't enter the market after the pin bar closes?
The trade may leave without you if you're not in the market.
trading risk_management -
What influences the entry options for trading pin bars?
The candle anatomy, market conditions, and your money management strategy.
trading pin_bars -
What does the pin bar indicate in trading?
It signals potential reversal or continuation of the trend.
trading pin_bar -
What is the importance of stop loss in trading?
To manage risk and protect against significant losses.
trading risk_management -
What does the chart in the example illustrate?
A candlestick chart showing a downtrend market with support becoming resistance.
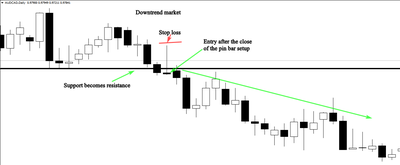 trading chart
 -
What are the three important elements for executing a trade?
- The trend: Market trending down for selling opportunities.
- The level: Support level that becomes resistance.
- The signal: Clear pin bar formed after retracement to resistance level.
trading strategy -
What should be done after the close of the pin bar?
Place your trade and set the stop loss above the long tail.
trading strategy -
Where should your profit target be in a downtrend?
The next support level.
trading strategy -
What is the conservative entry option?
Enter the market after 50% of the range bar retracement.
trading strategy -
What risk/reward ratio can the conservative entry option provide?
More than 5:1 risk/reward ratio.
trading strategy -
What is the risk of the conservative entry option?
The market may leave without you.
trading strategy -
What does a clear pin bar signal indicate?
It indicates a potential entry point after a retracement.
trading signal -
What happens when the market is trending down?
Look for selling opportunities.
trading trend -
What does a support level becoming resistance signify?
It indicates a potential reversal point for selling.
trading levels -
What is the importance of the three elements in trading?
They help find high probability entries in the market.
trading strategy -
What currency pair is being analyzed in the chart?
NZD/USD
forex currency_pairs -
What is the current price of NZD/USD in the analysis?
0.72080
forex prices -
What trend is indicated in the market analysis?
Downtrend Market
forex trends -
What is a significant technical feature mentioned in the analysis?
Resistance level
forex technical_analysis -
What does S.L stand for in trading?
Stop Loss
forex trading_terms -
What candlestick pattern is noted in the analysis?
50% pin bar
forex candlestick_patterns -
What is the purpose of a retracement in trading?
To identify potential entry points
forex trading_strategies -
What is the risk/reward ratio mentioned for the trade?
More than 5:1
forex risk_management -
How often is one trade like this suggested to generate decent income?
Every month
forex trading_frequency -
What does the illustration suggest about conservative entries?
They help decrease risks and increase rewards
forex trading_strategies -
What type of chart is used in the analysis?
A candlestick chart
forex charting -
What does the illustration provide insight into?
The power of conservative entries
forex trading_strategies -
What is the entry point suggested in the analysis?
50% pin bar retracement entry
forex entry_points -
What is one trade's potential to generate income according to the analysis?
A decent income
forex income_generation -
What is depicted in the accompanying image?
A candlestick chart showing a downtrend market with a resistance level and a 50% pin bar retracement entry.
forex technical_analysis -
What does 'support becomes resistance' mean in trading?
It refers to a price level where a stock previously found support and later fails to break above, acting as a new resistance level.
trading support resistance -
What is a '50% pin bar'?
A candlestick pattern indicating a potential reversal, where the open and close are near the low, and the high is significantly higher, showing rejection of higher prices.
trading candlestick pin_bar -
What is a 'retracement' in trading?
A temporary reversal in the direction of a price trend, often used to identify entry points for trades.
trading retracement -
What is the significance of the 'entry' point in trading?
The moment a trader decides to buy or sell an asset, ideally at a favorable price to maximize potential profit.
trading entry -
What is a 'stop loss' in trading?
An order placed to sell a security when it reaches a certain price, used to limit potential losses.
trading stop_loss -
What is a drawback of the 50% pin bar entry option?
The market may not retrace to 50% of the range bar, potentially resulting in missed profit opportunities.
trading drawbacks pin_bar -
How can experience influence trading decisions?
With time and experience, traders can better decide whether to trade aggressively or conservatively based on market conditions.
trading experience strategy -
What is the visual representation of 'support becomes resistance'?
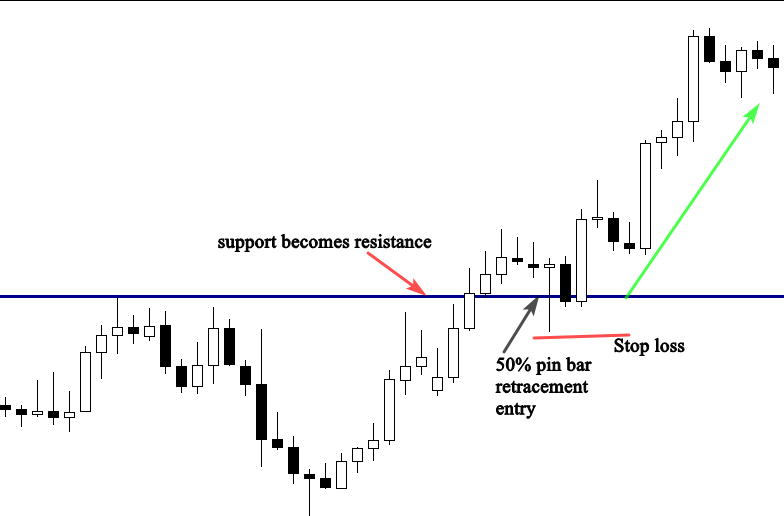 trading visual chart
 -
What is confluence in trading?
Confluence occurs when multiple technical indicators generate the same signal, helping traders filter entry points and identify high probability signals.
trading confluence -
Why is trading with confluence important?
Trading with confluence helps focus on quality setups rather than quantity, enhancing overall trading performance.
trading performance -
What does confluence mean?
Confluence means combination or conjunction, where two or more factors join together for confirmation.
trading definition -
What is the first factor of confluence to consider?
The trend is the first factor; successful traders check if setups align with market direction.
trading trend -
How does a bearish pin bar perform in a downtrend?
A bearish pin bar in a downtrend is a more powerful signal than one in a range-bound market.
trading pin_bar -
What role do support and resistance levels play in confluence?
Support and resistance levels are significant as major market participants monitor these areas.
trading support resistance -
What moving averages does the author use for confluence?
The author uses the 8 and 21 moving averages as dynamic support and resistance in trending markets.
trading moving_averages -
What Fibonacci levels are used for confluence?
The author uses the 61% and 50% Fibonacci retracement levels to identify powerful market areas.
trading fibonacci