Sign up to unlock more features
- Save this deck to your account
- Study flashcards with spaced repetition
- Export to Anki (.apkg) or PDF
- Process documents up to 100 pages
- Images extracted from PDFs and documents
- Better text extraction from your PDFs and documents
- Better flashcards with our more advanced AI model
What model is discussed in this chapter?
How does a country's standard of living depend on its saving rate?
What is the 'Golden Rule' in economics?
In this chapter, you will learn about the _______.
A country's standard of living depends on its _______.
To find the optimal saving rate and capital stock, you use the _______.
What chapter discusses the closed-economy Solow model?
Chapter 10
Chapter 7
Chapter 9
Chapter 8
What is depicted in the accompanying image?
Who stated that the consequences for human welfare from growth matters are staggering?
In what year did Bob Lucas win the Nobel Prize?
The consequences for human welfare involved in questions like these are simply staggering: once one starts to think about them, it is hard to think about anything else ... _______ (Nobel Prize, _______).
What is the main theme of Bob Lucas's statement?
What did Bob Lucas emphasize regarding growth?
Its irrelevance to economies
Its historical impact
Its potential risks
Its significance for human welfare
What field is Bob Lucas associated with?
What does Bob Lucas argue is hard to ignore?
What visual representation accompanies Bob Lucas's statement?
What does the graph illustrate?
The US Real GDP Per Capita shows a significant upward trend after around _______.
From which year does the graph start?
1790
1800
1850
1900
What is the maximum value shown on the y-axis?
50,000
40,000
60,000
30,000
What type of dollars is used in the graph?
What overall trend does the graph show for US Real GDP Per Capita?
The graph features a line graph displaying US Real GDP Per Capita from _______ to _______.
What major change in the trend is noted around the mid-20th century?
What is the impact of economic growth on living standards?
What is shown in the poverty headcount ratio graph from 1981 to 2017?
Which poverty line showed a decrease in the headcount ratio from 1981 to 2017?
$3.65 a day
$5.00 a day
$6.85 a day
$7.00 a day
$4.00 a day
$2.15 a day
Economic growth leads to a decrease in poverty levels, as indicated by the downward trend in the poverty headcount ratio. The poverty lines are: _______, _______, and _______.
Between 1981 and 2017, the poverty headcount ratio for all three lines indicates a general trend of _______ in poverty.
What does even a tiny change in the annual growth rate affect?
What is the increase in standard of living after 25 years with a 2.0% growth rate?
338.6%
85.4%
64.0%
1,083.5%
What is the increase in standard of living after 50 years with a 5% growth rate?
1,146.7%
624.5%
11,739.1%
243.7%
What is the increase in standard of living after 100 years with a 10% growth rate?
624.5%
1,378,061.2%
1,146.7%
338.6%
With an annual growth rate of 2.5%, the increase in standard of living after 50 years is _______.
An annual growth rate of 2.0% means an increase in standard of living after 100 years of _______.
In the long run, a growth rate of _______ leads to an extraordinary increase in living standards, over _______ after 100 years.
What growth rate results in a 338.6% increase in standard of living after 25 years?
What can growth theory help us understand?
How can growth theory aid in policy design?
What impact do shocks and government policies have?
Growth theory lessons can help us understand _______.
Growth theory allows us to design policies to help _______.
Our own growth rate is affected by _______ and _______.
What positive difference can growth theory make?
It can reduce inflation.
It can increase taxes.
It can eliminate poverty.
It can improve the lives of hundreds of millions.
Who is the Solow model named after?
What prize did Robert Solow win?
What is the Solow model used for?
The Solow model serves as a benchmark against which most recent growth theories are compared, focusing on the determinants of economic growth and the standard of living in the _______.
What is the change in the capital (K) in the Solow model?
What causes labor (L) to change in the Solow model?
How is the consumption function in the Solow model described?
What factors are removed for simplification in the Solow model?
What type of differences are mentioned in the Solow model?
What is the production function in aggregate terms?
How is output per worker defined?
How is capital per worker defined?
What does the assumption of constant returns to scale imply?
What happens when \(z = 1/L\)?
How can you express \(y\) in terms of \(f(k)\)?
What does the production function exhibit?
The graph shows output per worker (y) on the vertical axis and capital per worker (k) on the horizontal axis, illustrating output, _______, with MPK indicated.
What is represented on the vertical axis of the graph?
What is represented on the horizontal axis of the graph?
Which concept indicates that as more capital is added, the additional output produced decreases?
Constant Returns
Diminishing Marginal Product of Capital
Increasing Returns
Negative Returns
What is the function shown in the graph?
What does MPK stand for in the context of production?
Marginal Product of Capital
Average Product of Labor
Marginal Product of Labor
Total Product of Capital
What is the national income identity formula?
What does y represent in 'per worker' terms?
What is 'c' in the equation y = c + i?
What is 'i' in the equation y = c + i?
What does 's' represent in the consumption function?
What is the consumption function formula?
What is an important note about 's'?
What is the formula for saving per worker?
What is the national income identity?
In terms of savings and investment, what is \(i\)?
How is investment expressed in terms of saving?
Saving per worker is calculated as: \(saving = y - c = y - (1 - s)y = _______\)
The national income identity is expressed as: \(y = c + _______\)
What does \(i\) represent in the national income identity?
Investment
Consumption
Output
Savings
What does the equation \(i = sy\) signify?
Investment equals Saving
Output equals Investment
Savings equals Income
Income equals Consumption
What does 'y' represent in the context of output?
What is depicted by the variable 'C'?
What does investment per worker denote?
What variable represents investment?
How is capital per worker represented?
The graph shows the relationships between output (_______), consumption (_______), and investment (_______).
What is the relationship shown in the graph regarding investment?
Investment is constant.
Investment does not affect output.
Investment only depends on capital.
Investment is related to output.
What does the symbol 'dk' represent?
What is 'Sk' in the context of depreciation?
What is 'k' in relation to capital?
In the equation, what does '5' signify?
What does 'k' represent in terms of capital stock?
Depreciation per worker is represented as _______ while capital per worker is represented as _______.
What is the relationship depicted in the graph of depreciation per worker?
Positive linear relationship
Negative linear relationship
Exponential growth
No relationship
What is the significance of depreciation in economics?
What is the basic idea behind capital accumulation?
What is the formula for the change in capital stock?
What is the abbreviated formula for change in capital stock?
If i = sf(k), what does the change in capital stock become?
What is the equation of motion for capital (k)?
What does the central equation of the Solow model determine?
The behavior of all the other endogenous variables depends on _______.
What does income per person (y) equal to in the Solow model?
What is the formula for consumption per person (c)?
What is the equation for steady state capital per worker?
What happens if investment covers depreciation?
What is denoted by k*?
If investment is just enough to cover depreciation, then \(sf(k) = _______}\), leading to capital per worker remaining constant at _______.
In the steady state, capital stock increases because investment exceeds _______.
The steady-state level of capital per worker is denoted as _______.
What represents the capital stock per worker when depreciation exceeds investment?
What is represented by k* in the context of capital?
Steady-state level of capital per worker
Depreciation rate
Investment level
Total capital stock
What denotes the investment curve in the model?
dk
k1
k2
sf(k)
What happens when the saving rate increases?
An increase in the saving rate leads to a rise in _______, resulting in the capital stock growing toward a new steady state.
What is represented by k₁ and k**₂?
What is the relationship illustrated by the graph?
Investment and depreciation dynamics
Supply and demand
Business cycles
Market equilibrium
What does the capital per worker, k, signify?
The graph shows the relationship between investment and depreciation, with the notation indicating that an increase in the saving rate leads to higher _______.
How does depreciation impact capital stock?
What are the effects of increased investment on capital stock?
In the steady state, increases in steady-state capital below the Golden Rule raise steady-state consumption and above the Golden Rule reduce it. Thus, steady-state consumption changes as we move in relation to the _______.
What does k* represent in the context of steady-state?
What happens to steady-state consumption below the Golden Rule?
What happens to steady-state consumption above the Golden Rule?
What does dk* refer to in steady-state depreciation?
What signifies steady-state output?
What does C* refer to in the context of the steady-state?
gold
capital
depreciation
investment
The steady-state capital per worker is represented by _______ and relates to both steady-state output and depreciation.
What is the relationship between steady-state capital and output?
What graphical representation is related to steady-state concepts?
What does the formula Δk = sf(k) - δk represent?
What changes occur in capital per worker as you move toward the steady state?
As shown in the graph, the formula for change in capital per worker is Δk = sf(k) - _______.
In the steady state, what balances out in terms of capital?
Investment equals depreciation
Depreciation is greater than investment
Investment fluctuates wildly
Investment is greater than depreciation
The graph illustrates that as capital per worker increases, _______ rises while _______ also increases.
What are the components of the formula Δk = sf(k) - δk?
What signifies investment in the context of capital?
What represents depreciation in the formula Δk = sf(k) - δk?
What key concept is illustrated in the accompanying graph?
The formula for change in capital per worker is _______.
What does 'sf(k)' represent in the formula?
What does 'δk' signify in the formula?
In the steady-state, what is the condition of capital per worker?
What is represented by 'k*'?
What do investment and depreciation influence in an economy?
Capital per worker
Total population
Labor force participation
Government spending
How is 'depreciation' illustrated in the investment graph?
In the graph provided, what does the investment line look like?
What is the formula for the change in capital per worker (Δk)?
What do the variables in the formula Δk = sf(k) - δk represent?
The equation for change in capital per worker is: Δk = _______ - _______.
What is represented by 'sf(k)' in the change in capital formula?
Depreciation
Investment
Total output
Savings
What does 'δk' refer to in the formula Δk = sf(k) - δk?
Depreciation
Capital
Investment
Savings
What does the graph depicting investment and depreciation illustrate?
What happens to investment when k is less than k*?
What is the formula for change in capital per worker (Δk)?
As long as k < k, investment will exceed 8, and k will continue to grow toward _______.
Investment and depreciation are analyzed using the formula: Δk = sf(k) - δk, illustrating the interaction between _______ and _______.
What does sf(k) represent in the Δk formula?
What indicates the level of depreciation in the Δk formula?
What graphical relationship does the investment and depreciation graph illustrate?
An increase in the saving rate leads to higher _______ and a growth in the _______.
What is shown in the graph regarding investment and depreciation?
What does the x-axis represent in the savings rate graph?
The increase in the saving rate shifts the curve toward a new steady state for _______ and _______.
What do we call the new equilibrium achieved after an increase in the saving rate?
Which graph illustrates the effect of an increased saving rate on capital accumulation?
What does the Solow model predict regarding savings and investment?
The Solow model predicts that countries with higher rates of saving and investment will have higher levels of _______ and _______ per worker in the long run.
Are the data consistent with the Solow model prediction?
What leads to different steady states in the Golden Rule?
What is the 'best' steady state according to the Golden Rule?
What happens to k and y with an increase in s?
How does an increase in s affect c*?
How do we maximize c* in the Golden Rule?
What does k* represent in the Golden Rule?
What is the formula for consumption in the steady state?
In the steady state, what is the relationship between investment and capital?
The Golden Rule level of capital, denoted as k, maximizes consumption. To find it, first express c in terms of k: c = y - i = f(k) - i = f(k) - δk. In the steady state: i = _______ because A_______ = _______.
What is the steady-state investment equation in the Golden Rule?
i = δk
i = ky
i = k
i = f(k)
What does c* equal in the steady state?
How is c* calculated?
c = f(k) - δk*
c = f(k) - k*
c = ki
c = y + i*
What does Ak = 0 imply in the steady state?
What does δ represent in i = δk?
What is the significance of the Golden Rule level of capital?
What function is involved in determining c*?
Where can you view the formula for consumption in the steady state?
To reach the Golden Rule steady state, the economy needs the right _______.
What does the graph demonstrate?
What is represented by k* in the context of the graph?
What do the functions f(k) and δk indicate?
What is the primary objective of reaching the Golden Rule steady state?
Increasing savings
Minimizing debt
Maximizing consumption
Maximizing output
What is the formula for steady-state output and depreciation?
At what point is the steady-state capital stock largest?
What does MPK equal in the Golden Rule steady-state?
In the steady state, below the Golden Rule, increases in steady-state capital raise steady-state _______.
Above the Golden Rule steady state, increases in steady-state capital reduce steady-state _______.
What does k* gold represent?
What does the economy lack a tendency to move towards?
What must policymakers adjust to achieve the Golden Rule?
What does the adjustment of 's' lead to?
The transition to the Golden Rule affects consumption during the transition period. What happens to consumption as we move towards the _______?
Starting with too much capital, if \(k^*\) is greater than \(k\), then increasing \(c^*\) requires a fall in \(s\). In the transition to the Golden Rule, consumption is higher at all points in time.
What happens when transitioning to the Golden Rule?
What is the relationship shown in the graphs regarding saving rates?
Higher saving rates lead to higher investment
Reduction in saving rates leads to higher consumption
No relationship between investment and consumption
Consumption decreases when saving increases
What elements are illustrated in the time series graphs?
What is depicted in the graph focused on reducing the saving rate?
Starting with too little capital, if \(k* < k\) gold, then increasing the saving rate \(c*\) requires an increase in \(s\). Future generations enjoy higher consumption, but the current one experiences an initial drop in consumption.
What occurs when the saving rate is increased?
What happens to consumption in the current generation when starting with too little capital?
Falls to zero
Remains constant
Increases immediately
Experiences an initial drop
What is depicted in the time series graph?
What does the Solow growth model show about a country's standard of living?
What happens when there is an increase in the saving rate?
What happens when the economy has more capital than the Golden Rule level?
What happens when the economy has less capital than the Golden Rule level?
If the economy has more capital than the Golden Rule level, then reducing saving will _______ at all points in time, making all generations better off.
If the economy has less capital than the Golden Rule level, then increasing saving will _______ but _______.


Flashcards in this deck (238)
-
economics solow_model
-
How does a country's standard of living depend on its saving rate?
A higher saving rate generally leads to a higher standard of living.
economics standard_of_living -
What is the 'Golden Rule' in economics?
It is used to find the optimal saving rate and capital stock.
economics golden_rule -
economics solow_model
-
economics standard_of_living
-
economics golden_rule
-
economics chapters
-
visual chapter
-
economics growth
-
economics awards
-
The consequences for human welfare involved in questions like these are simply staggering: once one starts to think about them, it is hard to think about anything else ... Bob Lucas (Nobel Prize, 1995).
economics growth -
economics growth
-
What did Bob Lucas emphasize regarding growth?
Its irrelevance to economies
Its significance for human welfare
Its potential risks
Its historical impact
economics growth -
economics nobel
-
economics growth
-
economics visuals
-
What does the graph illustrate?
The graph illustrates the US Real GDP Per Capita (year 2005 dollars) from 1790 to 2006.
economics gdp -
economics gdp
-
economics gdp
-
economics gdp
-
economics gdp
-
What overall trend does the graph show for US Real GDP Per Capita?
The graph shows a generally increasing trend.
economics gdp -
economics gdp
-
What major change in the trend is noted around the mid-20th century?
A significant upward surge in US Real GDP Per Capita.
economics gdp -
What is the impact of economic growth on living standards?
Economic growth raises living standards and reduces poverty.
economics growth -
What is shown in the poverty headcount ratio graph from 1981 to 2017?
The graph shows a downward trend in poverty for three lines: \(6.85**, **\)3.65, and $2.15 a day.
poverty graph -
Which poverty line showed a decrease in the headcount ratio from 1981 to 2017?
$6.85 a day
$4.00 a day
$7.00 a day
$3.65 a day
$2.15 a day
$5.00 a day
poverty data -
Economic growth leads to a decrease in poverty levels, as indicated by the downward trend in the poverty headcount ratio. The poverty lines are: \(6.85 a day, \)3.65 a day, and $2.15 a day.
economics poverty -
Between 1981 and 2017, the poverty headcount ratio for all three lines indicates a general trend of reduction in poverty.
poverty trend -
What does even a tiny change in the annual growth rate affect?
It has huge effects on long-run economic growth and living standards.
economics growth -
What is the increase in standard of living after 25 years with a 2.0% growth rate?
338.6%
64.0%
85.4%
1,083.5%
economics growth living_standards -
What is the increase in standard of living after 50 years with a 5% growth rate?
243.7%
1,146.7%
11,739.1%
624.5%
economics growth living_standards -
What is the increase in standard of living after 100 years with a 10% growth rate?
338.6%
1,378,061.2%
1,146.7%
624.5%
economics growth living_standards -
economics growth living_standards
-
economics growth living_standards
-
In the long run, a growth rate of 10% leads to an extraordinary increase in living standards, over 1,378,061.2% after 100 years.
economics growth -
economics growth living_standards
-
economics growth_theory
-
How can growth theory aid in policy design?
By designing policies that can help poor countries grow.
economics policy -
economics growth_rate
-
economics growth_theory
-
economics policy
-
economics growth_rate
-
What positive difference can growth theory make?
It can eliminate poverty.
It can increase taxes.
It can reduce inflation.
It can improve the lives of hundreds of millions.
economics impact -
economics growth theory
-
economics awards
-
economics policy
-
The Solow model serves as a benchmark against which most recent growth theories are compared, focusing on the determinants of economic growth and the standard of living in the long run.
economics growth -
What is the change in the capital (K) in the Solow model?
Investment causes it to grow; depreciation causes it to shrink.
economics solow_model -
economics solow_model
-
economics solow_model
-
economics solow_model
-
economics solow_model
-
What is the production function in aggregate terms?
The production function is expressed as \(Y = F(K, L)\).
economics production -
economics output
-
economics capital
-
What does the assumption of constant returns to scale imply?
It implies \(zY = F(zK, zL)\) for any \(z > 0\).
economics returns -
economics scaling
-
How can you express \(y\) in terms of \(f(k)\)?
You can express it as \(y = f(k)\), where \(f(k) = F(k, 1)\).
economics functions -
economics production
-
The graph shows output per worker (y) on the vertical axis and capital per worker (k) on the horizontal axis, illustrating output, f(k), with MPK indicated.
economics graphs -
economics graphs
-
economics graphs
-
Which concept indicates that as more capital is added, the additional output produced decreases?
Negative Returns
Diminishing Marginal Product of Capital
Constant Returns
Increasing Returns
economics production -
economics functions
-
What does MPK stand for in the context of production?
Marginal Product of Labor
Total Product of Capital
Marginal Product of Capital
Average Product of Labor
economics production -
economics national_income
-
economics per_worker
-
economics c
-
economics i
-
What does 's' represent in the consumption function?
The saving rate, the fraction of income that is saved.
economics consumption -
economics formulas
-
What is an important note about 's'?
's' is the only lowercase variable not equal to its uppercase version divided by L.
economics variables -
economics saving
-
economics income
-
economics investment
-
economics investment
-
economics saving
-
economics income
-
economics investment
-
What does the equation \(i = sy\) signify?
Income equals Consumption
Savings equals Income
Output equals Investment
Investment equals Saving
economics investment -
economics output
-
economics consumption
-
economics investment
-
economics investment
-
economics capital
-
economics graph
-
What is the relationship shown in the graph regarding investment?
Investment is related to output.
Investment is constant.
Investment does not affect output.
Investment only depends on capital.
economics investment -
economics depreciation
-
economics depreciation
-
economics capital
-
economics depreciation
-
What does 'k' represent in terms of capital stock?
The fraction of the capital stock that wears out each period.
economics capital -
economics depreciation
-
What is the relationship depicted in the graph of depreciation per worker?
Positive linear relationship
Exponential growth
Negative linear relationship
No relationship
economics graph -
What is the significance of depreciation in economics?
It represents the wear and tear on capital assets.
economics depreciation -
What is the basic idea behind capital accumulation?
Investment increases the capital stock; depreciation reduces it.
economics capital_accumulation -
What is the formula for the change in capital stock?
change in capital stock = investment – depreciation
economics formulas -
economics formulas
-
economics investment
-
economics solow_model
-
What does the central equation of the Solow model determine?
It determines the behavior of capital over time.
economics solow_model -
economics endogenous
-
economics income
-
economics consumption
-
economics steady_state
-
What happens if investment covers depreciation?
Capital per worker will remain constant: \(A_k = 0\).
economics investment -
economics steady_state
-
If investment is just enough to cover depreciation, then \(sf(k) = ext{δk}\), leading to capital per worker remaining constant at A_k = 0.
economics steady_state -
economics investment depreciation
-
economics capital steady-state
-
What represents the capital stock per worker when depreciation exceeds investment?
The capital stock decreases.
economics investment depreciation -
What is represented by k* in the context of capital?
Total capital stock
Depreciation rate
Investment level
Steady-state level of capital per worker
economics capital steady-state -
economics investment curves
-
What happens when the saving rate increases?
It raises investment, causing the capital stock to grow toward a new steady state.
economics investment -
An increase in the saving rate leads to a rise in investment, resulting in the capital stock growing toward a new steady state.
economics investment -
What is represented by k₁ and k**₂?
k₁ and k**₂ represent different levels of capital per worker as the economy moves toward a new steady state.
economics capital -
What is the relationship illustrated by the graph?
Market equilibrium
Business cycles
Investment and depreciation dynamics
Supply and demand
economics graph -
What does the capital per worker, k, signify?
It signifies the amount of capital available for each worker in the economy.
economics capital -
The graph shows the relationship between investment and depreciation, with the notation indicating that an increase in the saving rate leads to higher investment.
economics investment -
How does depreciation impact capital stock?
Depreciation reduces the capital stock over time, influencing the steady state.
economics depreciation -
What are the effects of increased investment on capital stock?
Increased investment enhances the capital stock, pushing it toward a new steady state.
economics investment -
In the steady state, increases in steady-state capital below the Golden Rule raise steady-state consumption and above the Golden Rule reduce it. Thus, steady-state consumption changes as we move in relation to the Golden Rule.
economics steady_state -
economics steady_state
-
What happens to steady-state consumption below the Golden Rule?
Increases in steady-state capital raise steady-state consumption.
economics golden_rule -
What happens to steady-state consumption above the Golden Rule?
Increases in steady-state capital reduce steady-state consumption.
economics golden_rule -
What does dk* refer to in steady-state depreciation?
dk* refers to steady-state depreciation and investment.
economics depreciation -
economics steady_state
-
economics steady_state
-
The steady-state capital per worker is represented by k* and relates to both steady-state output and depreciation.
economics steady_state -
What is the relationship between steady-state capital and output?
Steady-state capital per worker (k*) is directly related to steady-state output and depreciation.
economics steady_state -
What graphical representation is related to steady-state concepts?
The graph depicts steady-state capital per worker (k*) against steady-state output and depreciation.
economics graphs -
What does the formula Δk = sf(k) - δk represent?
Change in capital per worker (Δk) is the difference between investment (sf(k)) and depreciation (δk).
economics investment depreciation -
What changes occur in capital per worker as you move toward the steady state?
Investment and depreciation interact, influencing the capital per worker.
economics steady_state capital -
economics graph capital
-
In the steady state, what balances out in terms of capital?
Depreciation is greater than investment
Investment fluctuates wildly
Investment equals depreciation
Investment is greater than depreciation
economics steady_state -
The graph illustrates that as capital per worker increases, investment rises while depreciation also increases.
economics investment depreciation -
economics formula components
-
What signifies investment in the context of capital?
It is represented by the term sf(k) in the formula Δk = sf(k) - δk.
economics investment -
economics depreciation
-
What key concept is illustrated in the accompanying graph?
The relationship between investment and depreciation showing how they influence capital per worker.
economics graph concept -
economics investment
-
What does 'sf(k)' represent in the formula?
It represents total investment per worker, where 's' is the savings rate and 'f(k)' is output per worker.
economics investment -
economics depreciation
-
In the steady-state, what is the condition of capital per worker?
It remains constant, meaning that investment equals depreciation.
economics steady_state -
economics steady_state
-
What do investment and depreciation influence in an economy?
Capital per worker
Labor force participation
Government spending
Total population
economics capital -
economics depreciation
-
In the graph provided, what does the investment line look like?
The investment line is curved, indicating increasing returns to scale.
economics investment -
economics capital
-
What do the variables in the formula Δk = sf(k) - δk represent?
- Δk: Change in capital per worker
- sf(k): Investment
- δk: Depreciation
economics variables -
economics formulas
-
What is represented by 'sf(k)' in the change in capital formula?
Savings
Depreciation
Total output
Investment
economics investment -
economics depreciation
-
What does the graph depicting investment and depreciation illustrate?
It shows a linear increase in depreciation and a curved investment line.
economics graphs -
What happens to investment when k is less than k*?
Investment will exceed 8 and k will continue to grow toward k*.
economics investment -
economics formulas
-
economics investment
-
Investment and depreciation are analyzed using the formula: Δk = sf(k) - δk, illustrating the interaction between investment and depreciation.
economics investment depreciation -
What does sf(k) represent in the Δk formula?
The savings function depending on capital per worker k.
economics investment -
What indicates the level of depreciation in the Δk formula?
δk represents the level of depreciation.
economics depreciation -
What graphical relationship does the investment and depreciation graph illustrate?
A linear increase in depreciation with a curved investment line.
economics graphs -
economics capital
-
What is shown in the graph regarding investment and depreciation?
The graph illustrates the effect of an increased saving rate on capital accumulation.
graphs economics -
graphs economics
-
The increase in the saving rate shifts the curve toward a new steady state for investment and depreciation.
economics capital -
What do we call the new equilibrium achieved after an increase in the saving rate?
New steady state.
economics equilibrium -
Which graph illustrates the effect of an increased saving rate on capital accumulation?
Refer to the graph showing Investment and Depreciation.
graphs economics -
What does the Solow model predict regarding savings and investment?
Countries with higher rates of saving and investment will have higher levels of capital and income per worker in the long run.
economics solow_model -
The Solow model predicts that countries with higher rates of saving and investment will have higher levels of capital and income per worker in the long run.
economics solow_model -
Are the data consistent with the Solow model prediction?
The data needs to be analyzed to determine if they align with the predictions of the Solow model.
economics data_analysis -
economics steady_states
-
What is the 'best' steady state according to the Golden Rule?
The one with the highest possible consumption per person: \(c^* = (1 - s) f(k^*)\).
economics best_steady_state -
economics s_effect
-
How does an increase in s affect c*?
c is raised but consumption's share of income, \((1 - s)\), lowers c**.
economics s_effect consumption -
economics maximization
-
What does k* represent in the Golden Rule?
k represents the Golden Rule level of capital*, maximizing consumption.
economics capital -
What is the formula for consumption in the steady state?
c = y - i where y is output and i* is investment.
economics steady_state -
In the steady state, what is the relationship between investment and capital?
In the steady state: i = δk.
economics investment -
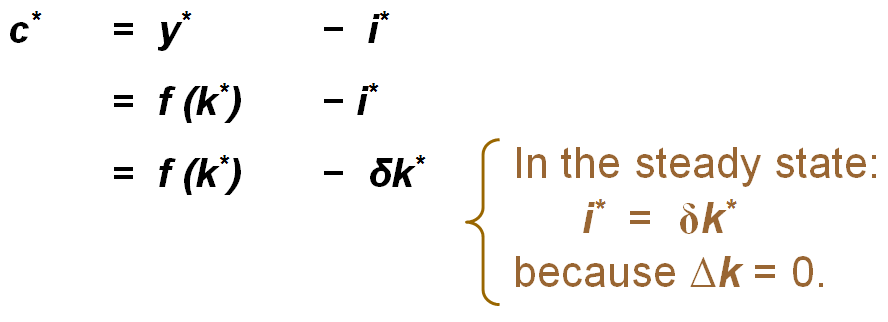
The Golden Rule level of capital, denoted as k, maximizes consumption. To find it, first express c in terms of k: c = y - i = f(k) - i = f(k) - δk. In the steady state: i = δk because Ak = 0.
economics golden_rule -
economics steady_state
-
economics consumption
-
economics consumption
-
economics steady_state
-
economics investment
-
What is the significance of the Golden Rule level of capital?
It is the level where consumption is maximized over the long term.
economics golden_rule -
What function is involved in determining c*?
The production function, f(k), is involved in determining c.
economics production -
Where can you view the formula for consumption in the steady state?
 - This image shows the formula for consumption in the steady state.economics visual
 -
economics growth
-
What does the graph demonstrate?
The determination of the Golden Rule steady-state capital stock that maximizes consumption.
economics graph -
economics capital
-
What do the functions f(k) and δk indicate?
They describe the relationship between output and depreciation per worker.
economics functions -
What is the primary objective of reaching the Golden Rule steady state?
Maximizing output
Maximizing consumption
Minimizing debt
Increasing savings
economics golden_rule -
economics capital_stock
-
At what point is the steady-state capital stock largest?
When the slope of the production function equals the slope of the depreciation line.
economics golden_rule steady_state -
economics golden_rule
-
In the steady state, below the Golden Rule, increases in steady-state capital raise steady-state consumption.
economics golden_rule steady_state -
Above the Golden Rule steady state, increases in steady-state capital reduce steady-state consumption.
economics golden_rule -
economics golden_rule capital_stock
-
economics steady_state
-
economics policy
-
economics steady_state
-
The transition to the Golden Rule affects consumption during the transition period. What happens to consumption as we move towards the Golden Rule?
economics steady_state -
Starting with too much capital, if \(k^*\) is greater than \(k\), then increasing \(c^*\) requires a fall in \(s\). In the transition to the Golden Rule, consumption is higher at all points in time.
economics golden_rule -
What happens when transitioning to the Golden Rule?
- Consumption is higher at all points in time.
- Investment is directly affected by the saving rate.
economics golden_rule -
What is the relationship shown in the graphs regarding saving rates?
Consumption decreases when saving increases
Reduction in saving rates leads to higher consumption
No relationship between investment and consumption
Higher saving rates lead to higher investment
economics graphs -
What elements are illustrated in the time series graphs?
- Output
- Consumption
- Investment
- Saving Rate reduction
economics graphs -
What is depicted in the graph focused on reducing the saving rate?
The graph illustrates the impact on output, consumption, and investment as the saving rate is reduced.
economics golden_rule -
Starting with too little capital, if \(k* < k\) gold, then increasing the saving rate \(c*\) requires an increase in \(s\). Future generations enjoy higher consumption, but the current one experiences an initial drop in consumption.
economics growth -
What occurs when the saving rate is increased?
- Output increases
- Consumption increases
- Investment increases
economics investment -
What happens to consumption in the current generation when starting with too little capital?
Increases immediately
Remains constant
Falls to zero
Experiences an initial drop
economics consumption -
What is depicted in the time series graph?
The effect of increased saving rate on output, consumption, and investment over time.
economics graphs -
What does the Solow growth model show about a country's standard of living?
It depends positively on its saving rate.
economics growth -
What happens when there is an increase in the saving rate?
- Higher output in the long run
- Faster growth temporarily
- Not faster steady-state growth
economics growth -
What happens when the economy has more capital than the Golden Rule level?
Reducing saving will increase consumption for all generations, making them better off.
economics capital golden_rule -
What happens when the economy has less capital than the Golden Rule level?
Increasing saving will boost future generations' consumption but decrease the present generation's consumption.
economics capital golden_rule -
If the economy has more capital than the Golden Rule level, then reducing saving will increase consumption at all points in time, making all generations better off.
economics capital golden_rule -
If the economy has less capital than the Golden Rule level, then increasing saving will increase consumption for future generations but reduce consumption for the present generation.
economics capital golden_rule -
-
-
-
-
-
-
-
-
-
-
-
-
-
-
-
-
-
-
-